


| Support Type | Frequency | Examples |
|---|---|---|
| DCEPS college-wide support | Ongoing support on a semester/annual basis or otherwise specified |
|
| Department or Program specific support | Depending on requirement (ad-hoc, semester/annual basis) |
|
| Individual faculty support and ad-hoc request | Depending on requirements (ad-hoc, semester/annual basis) |
|
Common Reminders
Data Starts with a Question
- What kind of data do I need for my grant writing/research proposal/reporting requirements?
- Where can I obtain this information?
- Canvas
- Available university software (student 360, Salesforce)
- LeoOnline report
- Published ODU reports by the Office of Institutional Research
- Factbook: Student headcount, degree conferred, student credit hour produced, faculty, fte
- Operational Reports: Enrollment dashboard, freshman outcome, transfer student outcome
- Reports previously shared within DCEPS (by Dean, ADs, Department Chairs, Xiaosong)
- Submit a data request
- When do I need the necessary information by? Can I plan to request or obtain the information ahead of time?
- Will there be recurring need for the particular information?
- What are the specific definitions for the information I need?
Frequently Asked Questions
Student Data Only
Faculty and staff related data should be directed towards Department Chairs or Academic Affairs
Student Enrollment
- Only actively registered and credit-bearing students are included for headcount enrollment
- Program enrollment by semester (fall, spring, summer)
- Student degree information (degree, program, major)
Student Outcome Data
- Degree conferral (degree awarded and status, program, degree award semester)
- Student GPA (semester GPA by semester, cumulative GPA at specific times, i.e., at the beginning/end of fall semester)
- Course grade
Student Information
- Student contact information (ODU email, personal email, phone number, address, zip code)
- [IRB approval required in some cases] Student demographics (gender, race/ethnicity, first-gen status, pell status, veteran status, military-affiliated status)
Submit DCEPS data request form via Qualtrics
- Form: bit.ly/dceps_data_request
- Provide sufficient parameter for requirement (semester of enrollment, student degree level, program)
- Provide context for request and applicable supporting documents
- Provide supporting student information for request (i.e. list of specific student UIN, etc.)
Typical lead time of 2 weeks for first-time request of a report
- Please do not indicate ASAP for report completion
- If there is an urgent request, please email separately with situation, will aim to accommodate
For recurring ongoing reports, can be delivered routinely after specific times upon needs
- After first day of class
- After add/drop of each semester
- After final grades are posted
Report Delivery Format
What format of data fits my need?
Individual Student Roster
Deliverable Format: Excel file (.xlsx) unless otherwise specified
Image
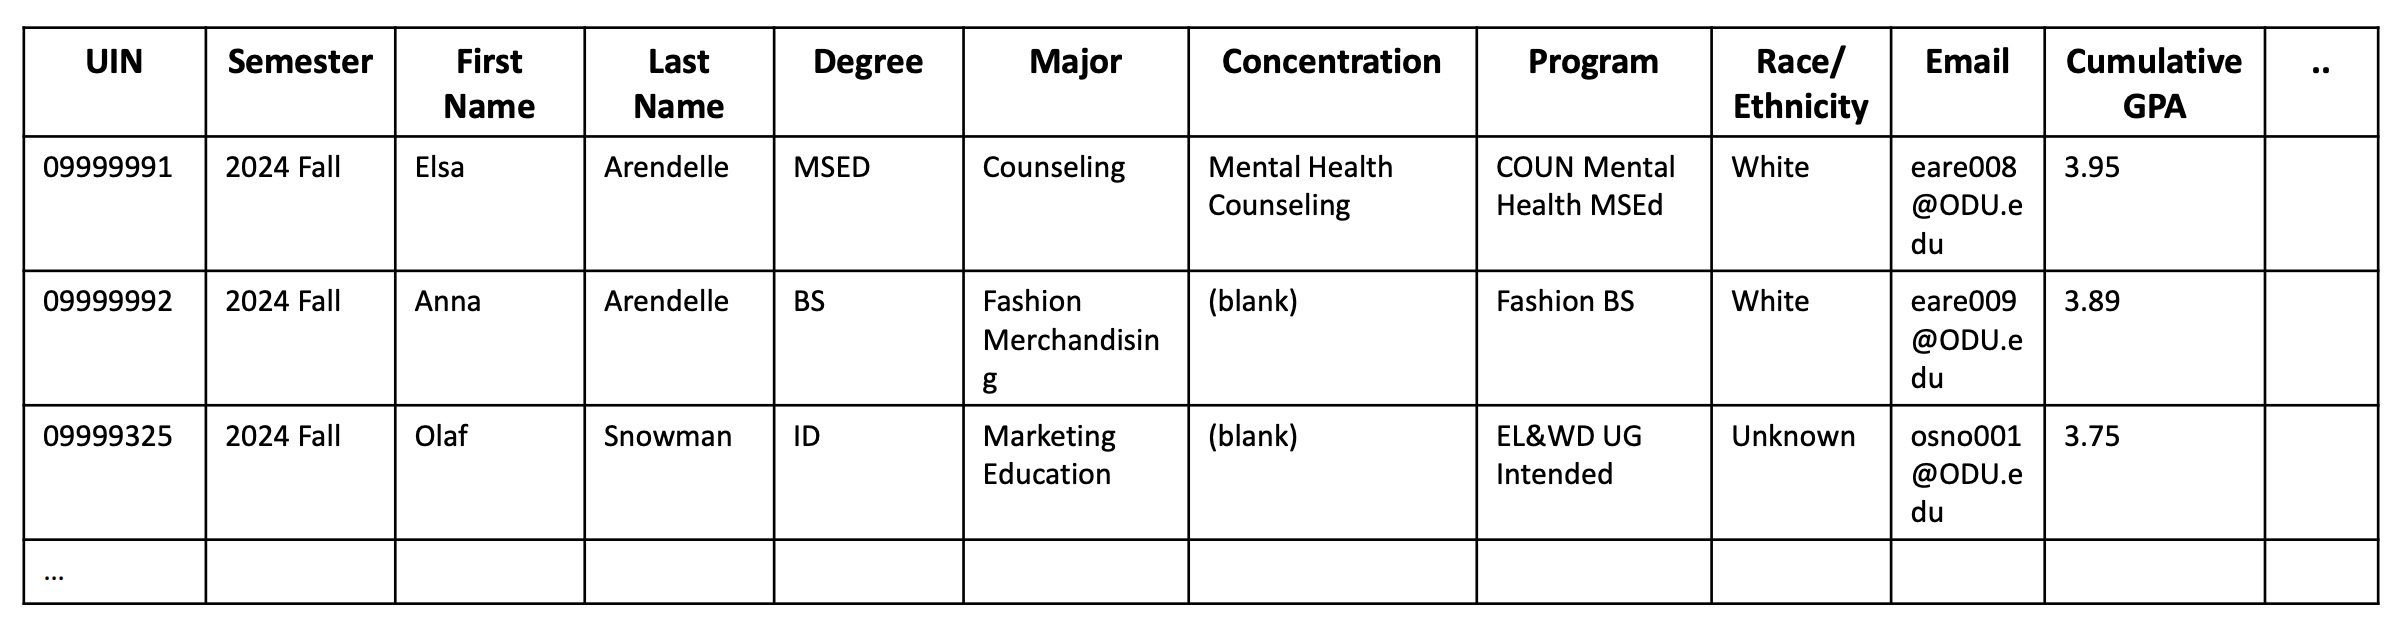
Questions:
- Which information do I need for each student?
- When, how, and where is each student information recorded? (i.e., Is it recorded when a student applies for ODU?)
- What are all the necessary parameters to filter and narrow down the students I am looking for?
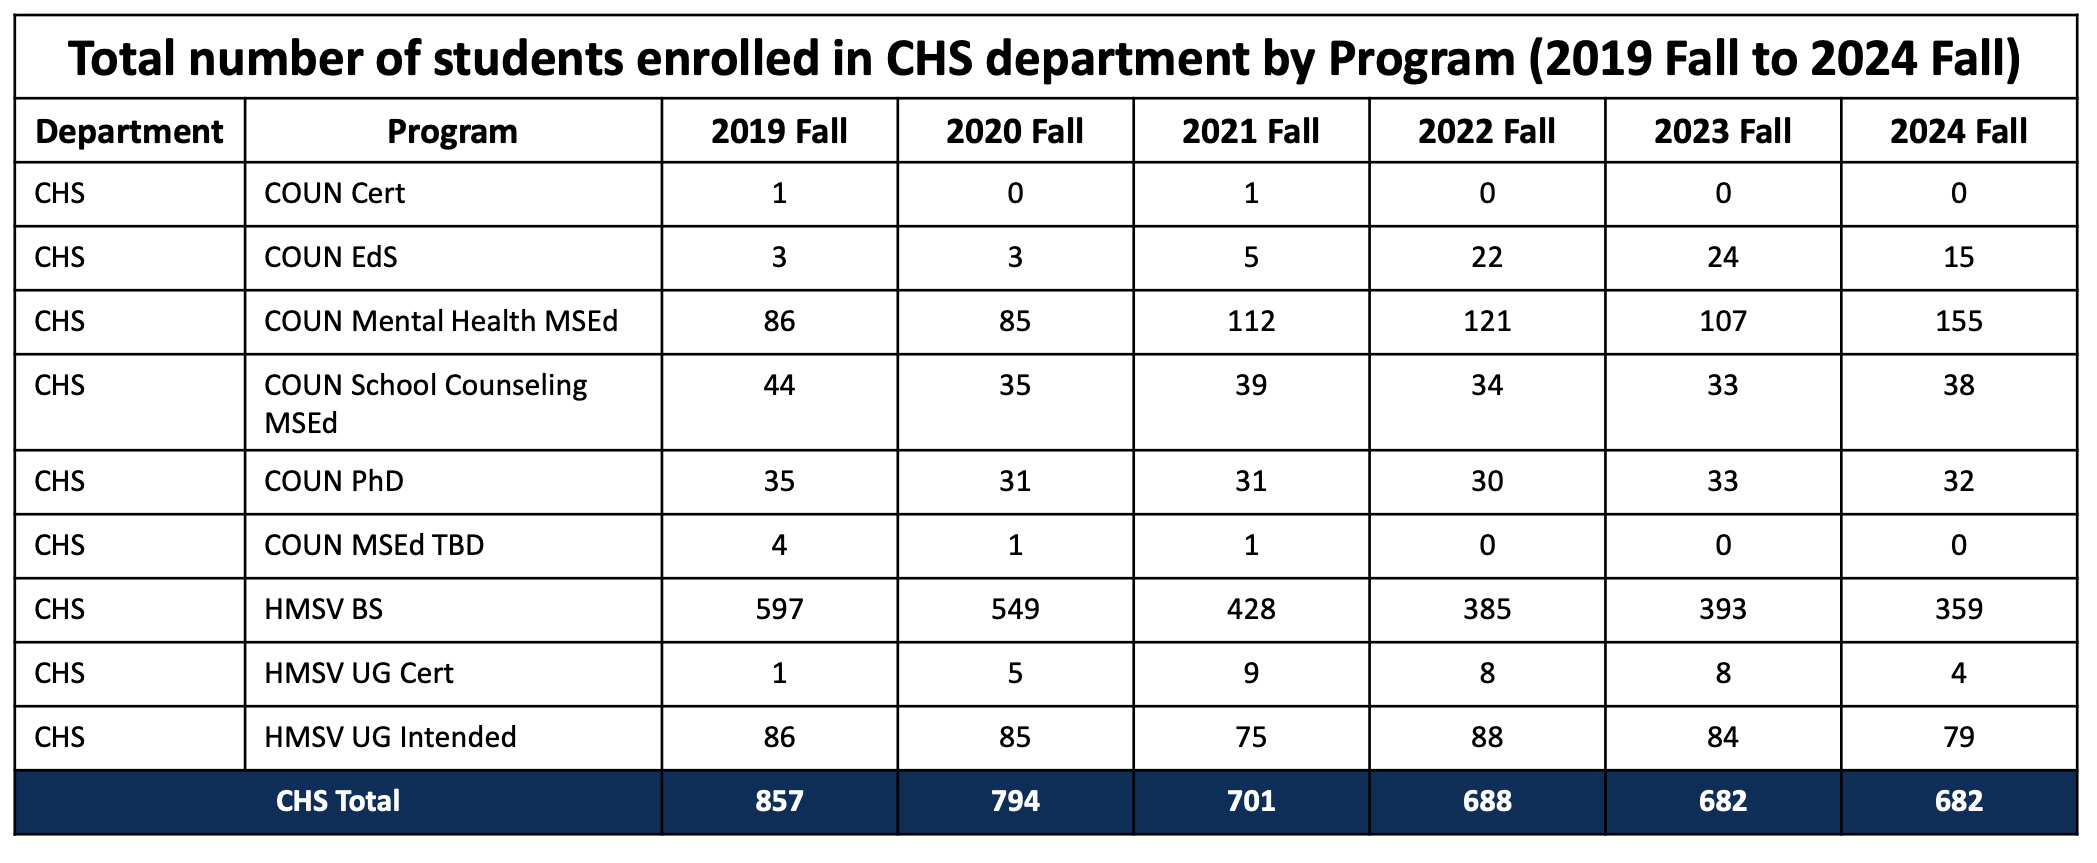
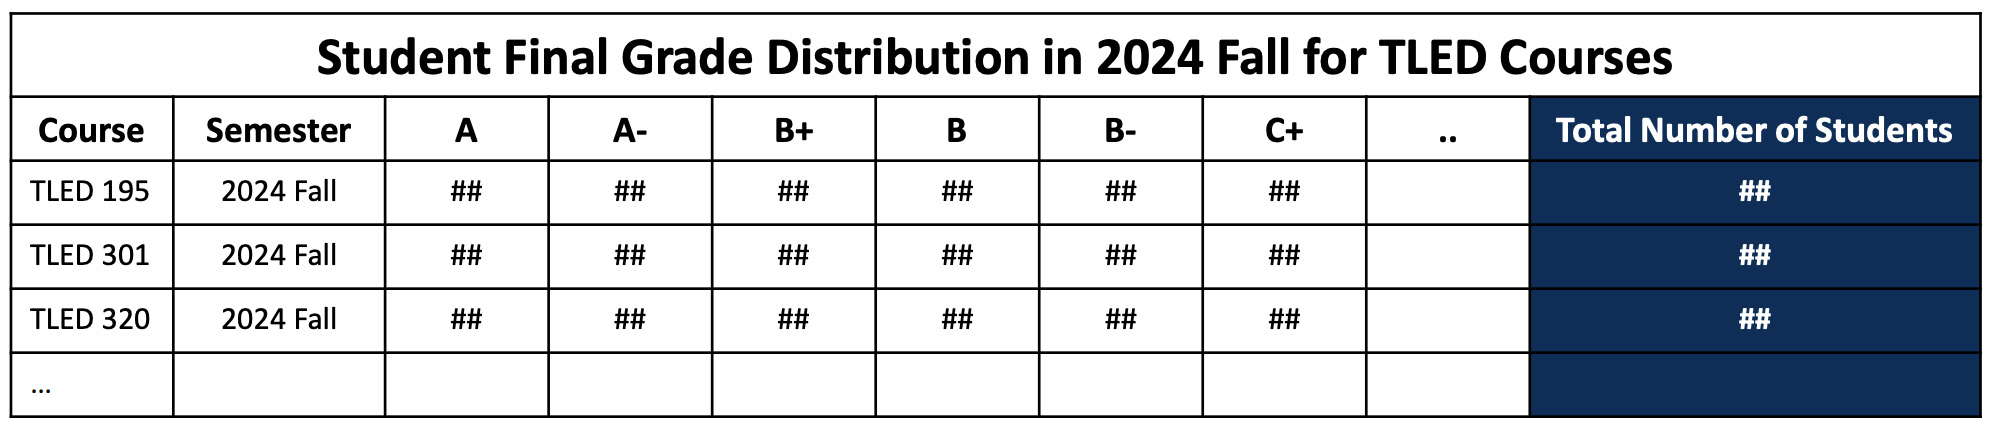
Aggregate Summary Report
Deliverable Format: Excel file (.xlsx) unless otherwise specified
Image
Image
Questions:
- What are the key takeaways I am looking for in this report?
- How do I want to use or analyze this information? Is it helpful to calculate the % of Total for each section?
- What are other ways to present the data more effectively for your need? Is a pie chart or line graph more effective or less effectove?
Data Dashboard in MS PowerBI
Deliverable Format: Interactive Microsoft PowerBI data dashboard accessible via webpage, can be exported to PDF
Example: TEC Data Inventory
Image
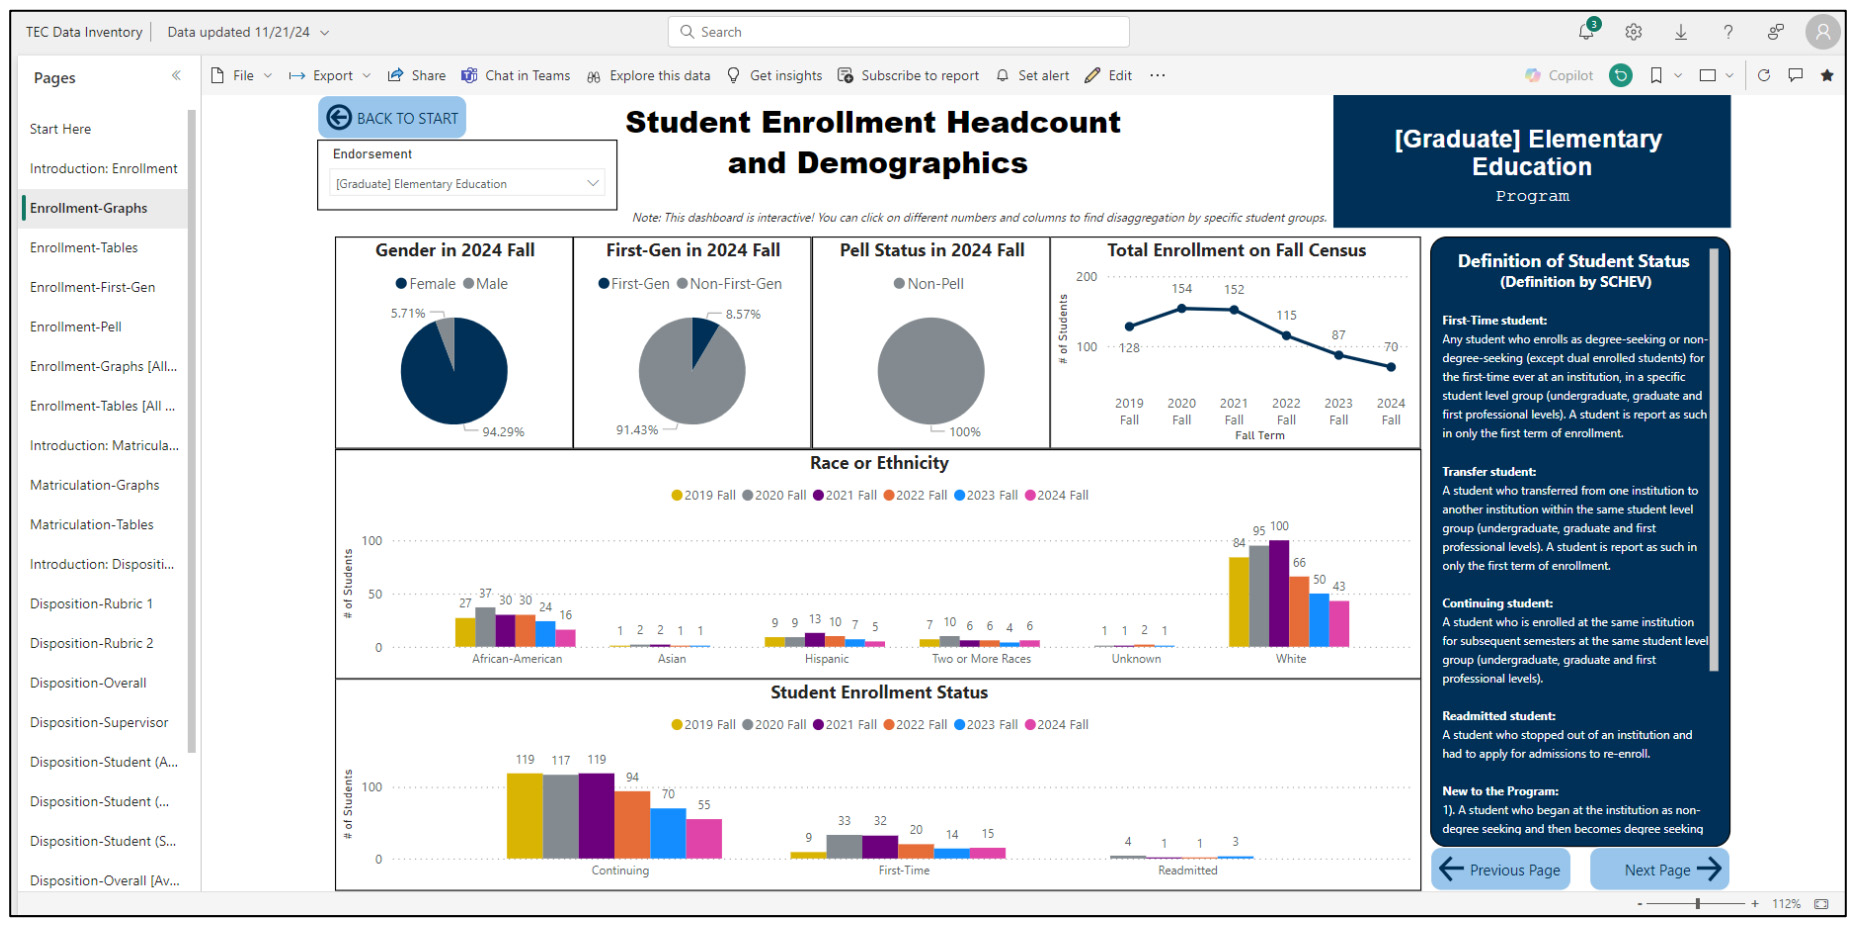
Pros of PowerBI dashboard:
- Mostly used for aggregate report purpose or discovery of trends and patterns
- Data can be updated continuously to reflect future changes or future semesters
- Can be easily accessed through a webpage without needing to download or open a specific file
- Report is interactive and can be drilled down by selected filters
- Report can be exported to PDF format but loses filter functions
- Data visualization can be more effective to convene information in many cases
- Data visualization is ready for presentation purpose
- Report requires longer time to build, but easier to maintain and update in the future Cons of PowerBI dashboard
- May require some learning curve to navigate and go through the reports
- Raw data of student roster is not accessible by the audience
- The report mostly remains in dashboard format (read-only) and cannot be transformed to Excel format
Questions:
- Can my program/department benefit from a data dashboard? If so, what are some specific uses?
- Are there scenarios when a dashboard is more efficient than a specific data request?
- What are some scenarios when a readily available dashboard is beneficial and useful for all programs in DCEPS?
Do you have a request for data, assessment or report?
Please fill out the form below to submit a request or schedule a meeting with Xiaosong Fan, Darden College of Education and Professional Studies assessment & accreditation analyst.