Old Dominion University’s 2023-2028 five-year strategic plan, “Forward-Focused: Where Innovation Meets Possibilities,” is built around seven key areas: Academic Excellence; Branding, Marketing, and Communication; Corporate/ Community Partnerships and Economic Development; Philanthropic Giving and Alumni Engagement; Research Growth; Strategic Enrollment Growth; and Student Engagement and Success. Together, these focal areas lay the groundwork for the University’s development and growth during the next five years.
To support the strategic plan, our student success goals include the following:
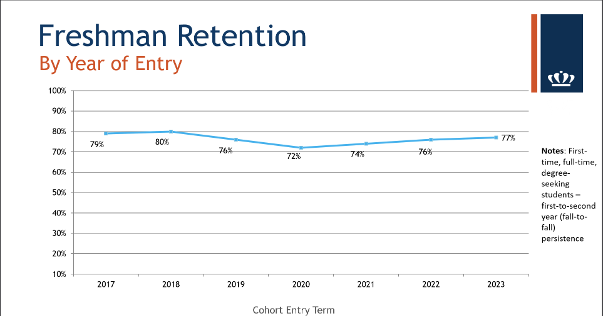
- Increase student retention rates to 82 percent by building on the campus-wide infrastructure that supports student success
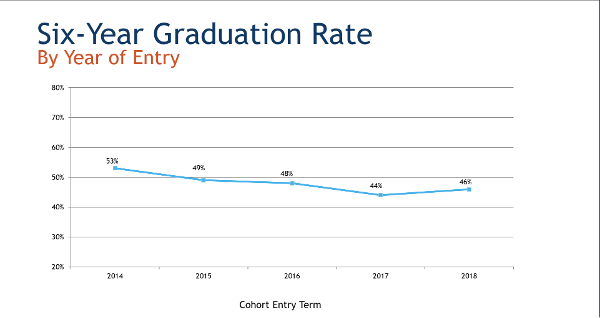
- Increase the 6-year graduation rate to 57% by 2028
- All programs with licensure exams will have at least a 90 percent pass rate on their licensure exams
- All athletic teams will achieve a four-year academic progress rate of 930 or above
Goals
Increase student retention rates to 82 percent by building on the campus-wide infrastructure that supports student success
Increase the 6-year graduation rate to 57% by 2028
All programs with licensure exams will have at least a 90 percent pass rate on their licensure exams
Education
| EXAM | 2021-2022 | 2022-2023 | 2023-2024 | 2024-2025 |
|---|---|---|---|---|
| RVE (for elementary, early childhood, and special education) | 93% | 100% | 100% | 100% |
| RVE (for reading specialists) | 100% | 100% | 100% | 100% |
| Comprehensive Professional Counseling Exam (CPCE) | 100% | 100% | 100% | 100% |
| School Leadership Licensure Assessment (SLLA) | 97% | 100% | 100% | 100% |
Health Sciences
| EXAM | 2021-2022 | 2022-2023 | 2023-2024 | 2024-2025 |
|---|---|---|---|---|
|
American Society of Clinical Pathology Board of Certification Exam (ASCP) (Medical Laboratory Scientist ) |
100% | 83% | 75% | 76% |
| National Board Dental Hygiene Exam | 91% | 100% | 100% | 100% |
| Clinical Installation Testing Assessment (CITA- Dental Hygiene) | 100% | 100% | 100% | 97% |
| National Certification examinations for Medical Technology/Medical Laboratory Science | 100% | 83% | 75% | 76% |
| Nuclear Medicine Technology Certification Board Exam (NMTCB) | 83% | 86% | 100% | 100% |
| Physical Therapy Licensing Exam (NPTE) | 95% | 92% | 86% | 97% |
Nursing
| EXAM | 2021-2022 | 2022-2023 | 2023-2024 | 2024-2025 |
|---|---|---|---|---|
| Nurse Anesthesia Certification Exam (NCE) | 85% | 100% | 100% | 100% |
| National Council of State Boards of Nursing (NCLEX) | 88% | 87% | 95% | 95% |
EVMS
School of Medicine (From the NBME)
| EXAM | 2021-2022 | 2022-2023 | 2023-2024 | 2024-2025 |
|---|---|---|---|---|
| USMLE Step 1 | 99% | 95% | 98% | 99% |
| USMLE Step 2 CK | 99% | 100% | 98% | 99% |
School of Health Professions
| EXAM | 2021-2022 | 2022-2023 | 2023-2024 | 2024-2025 |
|---|---|---|---|---|
| Physician Assistant PANCE | 95% | 95% | 97% | 95% |
| Surgical Assisting NCCSA | 100% | 100% | 100% | 100% |
| Surgical Assisting CSFA | 84% | 84% | 85% | 85% |
| Pathologists' Assistant ASCP | 100% | 100% | 93% | 100% |
All athletic teams will achieve a four-year academic progress rate of 930 or above
| Sport | 2020-2021 | 2021-2022 | 2022-2023 | 2023-2024 | 4-Year Avg |
|---|---|---|---|---|---|
| Baseball |
989 |
968 |
979 |
981 |
979.2 |
| Field Hockey |
940 |
962 |
960 |
957 |
954.8 |
| Football |
958 |
963 |
972 |
979 |
968 |
| Men's Basketball |
978 |
945 |
949 |
965 |
959.2 |
| Men's Golf |
1000 |
1000 |
984 |
967 |
987.8 |
| Men's Soccer |
951 |
940 |
953 |
951 |
948.8 |
| Men's Swimming and Diving |
1000 |
978 |
969 |
971 |
979.5 |
| Men's Tennis |
923 |
981 |
984 |
984 |
968 |
| Women's Basketball |
980 |
981 |
981 |
981 |
980.8 |
| Women's Golf |
1000 |
1000 |
1000 |
1000 |
1000 |
| Women's Lacrosse |
1000 |
996 |
1000 |
996 |
998 |
| Women's Rowing |
970 |
959 |
972 |
978 |
969.8 |
| Women's Soccer |
990 |
990 |
995 |
995 |
992.5 |
| Women's Swimming and Diving |
1000 |
994 |
994 |
994 |
995.5 |
| Women's Tennis |
1000 |
1000 |
1000 |
1000 |
1000 |
| Women's Volleyball |
1000 |
1000 |
1000 |
1000 |
1000 |


