
The following accessible charts describe graphics provided on EVMS Women in Medicine and Science. Originals are from The State of Women in Academic Medicine, published by the Association of American Medical Colleges, 2018 - 2019.
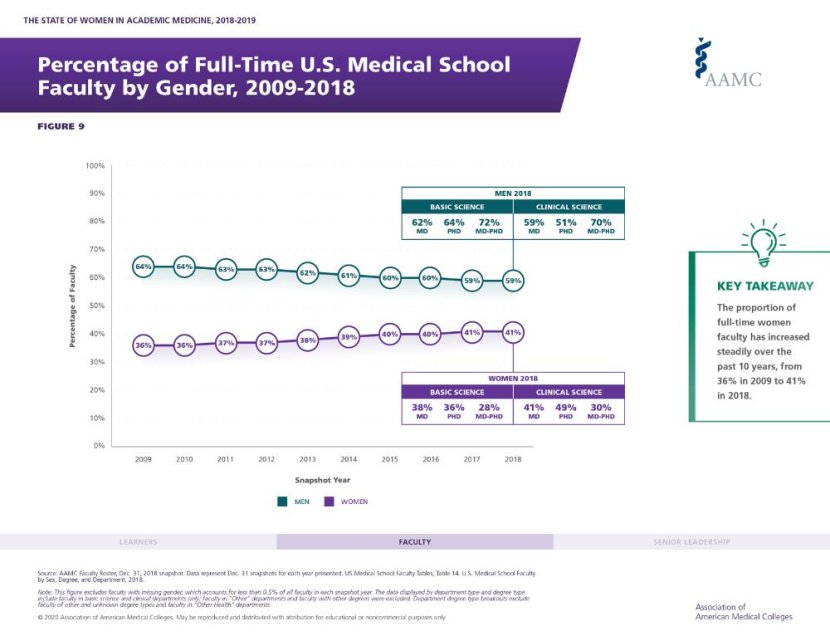
Percentage of Full-Time U.S. Medical School Faculty by Gender, 2009-2018
| Year | % Men | % Women |
|---|---|---|
| 2009 | 64% | 36% |
| 2010 | 64% | 36% |
| 2011 | 63% | 37% |
| 2012 | 63% | 37% |
| 2013 | 62% | 38% |
| 2014 | 61% | 39% |
| 2015 | 60% | 40% |
| 2016 | 60% | 40% |
| 2017 | 59% | 41% |
| 2018 | 59% | 41% |
Back to top
Percentage of Full-Time U.S. Medical School Faculty by Gender, 2009-2018
| Degree | Men | Women |
|---|---|---|
| MD | 62% | 38% |
| PhD | 64% | 36% |
| MD and PhD | 72% | 28% |
Back to top
Percentage of Full-Time U.S. Medical School Faculty by Gender, 2009-2018
| Degree | Men | Women |
|---|---|---|
| MD | 59% | 41% |
| PhD | 51% | 49% |
| MD and PhD | 70% | 30% |
Back to top
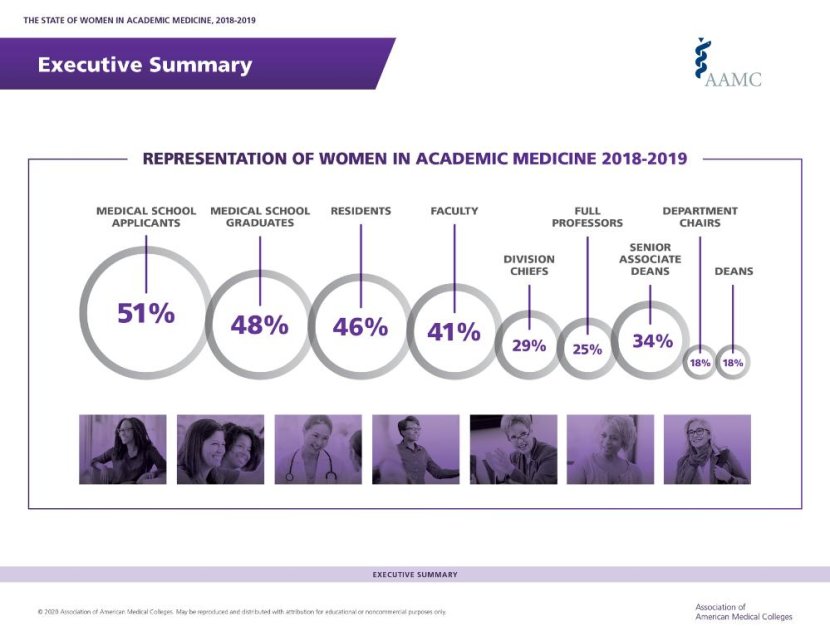
Representation of Women in Academic Medicine 2018-2019
| Type | % Women |
|---|---|
| Medical School Applicants | 51% |
| Medical School Graduates | 48% |
| Residents | 46% |
| Faculty | 41% |
| Division Chiefs | 29% |
| Full Professors | 25% |
| Senior Associate Deans | 34% |
| Department Chairs | 18% |
| Deans | 18% |
Back to top