Introduction
The Social Science Research Center (SSRC) at Old Dominion University recently completed data collection for the 12th annual Life in Hampton Roads (LIHR) survey. The purpose of the survey is to gain insight into residents' perceptions of the quality of life in Hampton Roads and the COVID-19 pandemic, as well as other topics of local interest such as perceptions of police, employment and other issues. A total of 796 online and telephone surveys were completed between July 12 and Oct. 3, 2021. It is important to note that the methodology this year differs from previous Life in Hampton Roads surveys. For several reasons, including continued concerns about COVID-19 and labor shortages, we conducted both telephone surveys and online panels. This change limits to some degree the ability to compare this year's results with those from previous years or to confidently generalize the results to the Hampton Roads population as a whole. Nonetheless, we note that an increasing number of surveys have moved online in recent years, and that in many instances useful data has been developed despite the challenges of online survey research. For more detailed information on the methodological changes and potential impacts please see the Methodology section in the full report, or please contact the SSRC directly.
The 2021 Life in Hampton Roads survey included two items which measured negative experiences with the police:
-
In the past year, have you or someone close to you had a negative experience with police (e.g., the officer shouted at you, cursed at you, pushed or grabbed you)?
-
In the past year, have you heard of someone in your local community who had a negative experience with police (e.g., the officer shouted at them, cursed at them, pushed or grabbed them)?
Both items refer to relatively serious negative encounters and are not issues related to standard daily encounters with the police. Response categories were simply "yes" and "no." These questions were also asked in the 2020 survey.
Experiences with Police
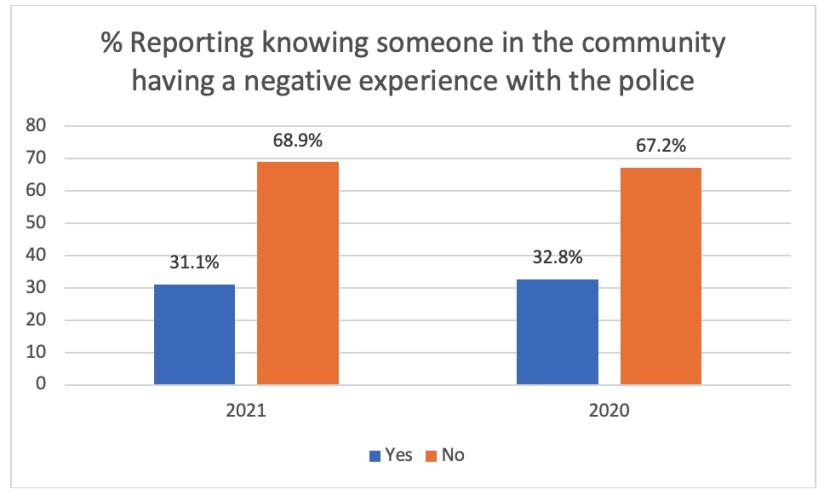
This year about 17% of respondents reported that they (or someone close to them) had had a negative experience with the police, down from the 20% reported last year. The percentage of residents having heard of someone in their local community who had had a negative encounter with the police was much larger. Indeed, nearly a third of respondents reported such knowledge in 2021 (31.1%) and 2020 (32.8%). This number is probably much higher because there are so many ways of hearing about unpleasant incidences - from family, friends or media sources.
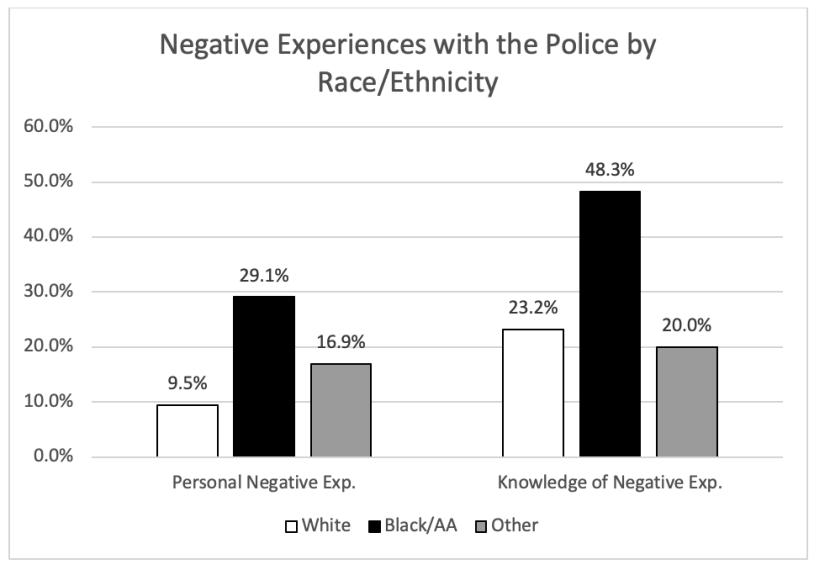
Consistent with last year's results, we also found significant differences in negative encounters with the police by race and ethnicity. African Americans (29%) were nearly three time more likely than whites (9.5%) to report that they or someone close to them had a negative experience with the police. Persons identifying as some other race or ethnicity were more likely to report this type of experience than whites, but much less likely than African Americans. Nearly half of African American respondents (48%) reported they had knowledge of a negative experience in the community. This percentage is more than twice that of white respondents (23%) or other identifying races (20%).
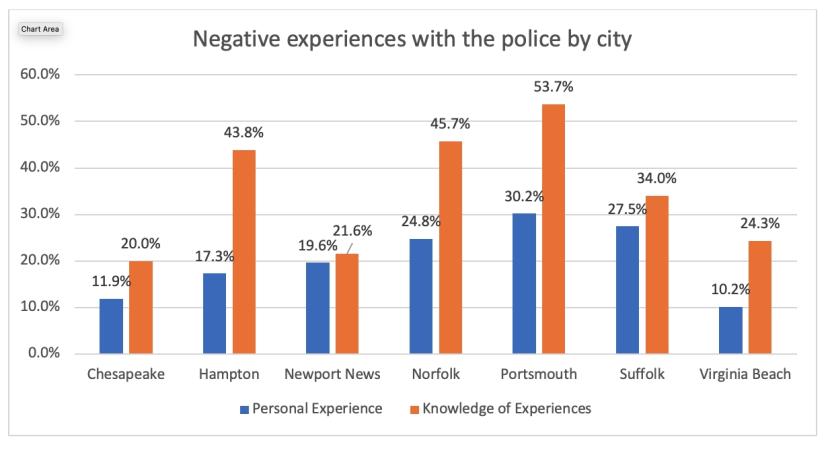
Negative experiences with the police also varied substantially by city. Focusing first on direct experiences or knowledge of someone close to them, Virginia Beach and Chesapeake reported the lowest rates at 10.2% and 11.9%, respectively. Hampton and Newport News were at 17.3% and 19.6%, respectively, then the percentages jump to 24.8% for Norfolk, 27.5% for Suffolk and 30.2% for Portsmouth. The pattern is similar for the second question focusing on knowledge of someone in the city having a serious negative encounter. Chesapeake and Virginia Beach were relatively low (20% and 24.3%), and Newport News was in that range as well (21.6%). The percentages increase for other cities, with Suffolk being 10 percentage points higher than any of those at 34% and Hampton another 10 percentage points higher (43.8%), followed by Norfolk (45.7%) and Portsmouth (53.7%).
Perceptions of Police
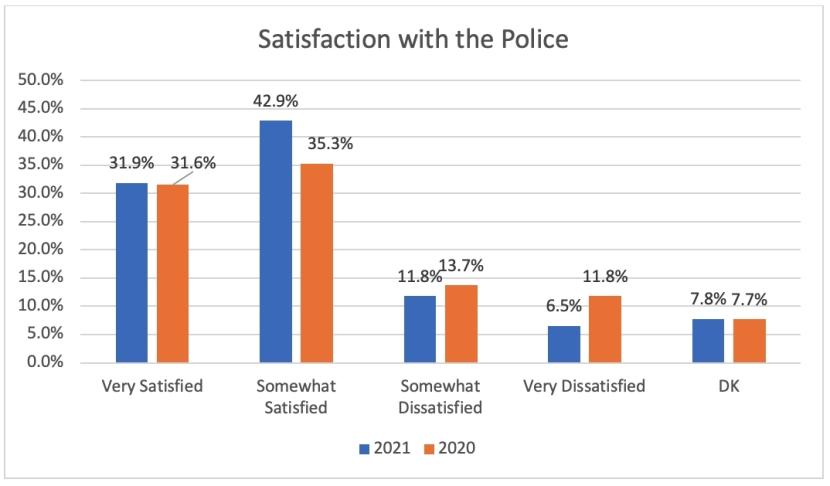
Hampton Roads residents were asked a variety of questions about their perceptions of the local police. Two of those questions were also asked in 2020; one focused on general satisfaction and the other with trust in the local police. In terms of general satisfaction, the vast majority of respondents (74.8%) were either very satisfied (31.9%) or somewhat satisfied (42.9%) in 2021. This is about a 7.9% increase from the 66.9% reporting being satisfied a year ago.
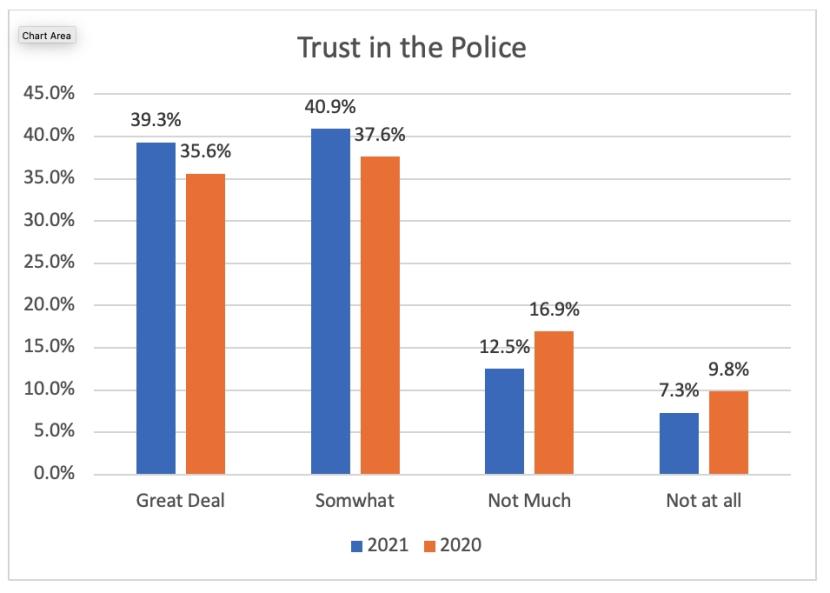
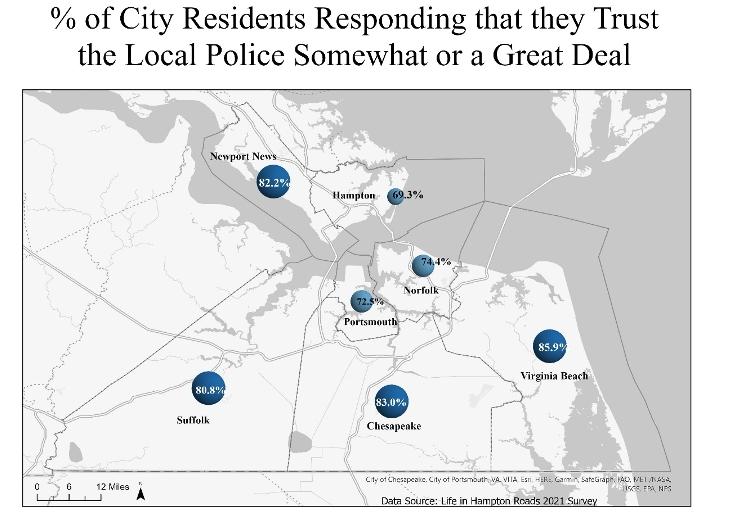
Similar to last year, the majority of residents (80.2%) either trusted the police a great deal (39.3%) or somewhat (40.9%). Combined, this total was up from 73% last year.
The 2021 survey also asked three new items about the police. Specifically, we asked "How would you rate the job police (in your city) are doing when it comes to each of the following: 1)
Using the right amount of force for each situation? 2) Treating racial and ethnic groups equally? 3) Protecting people from crime?" Response categories were excellent, good, fair and poor.
Again, the overall perceptions were positive. The highest rating came regarding the use of force with about 61% rating the local police as good (36.9%) or excellent (23.9%). Not far behind, about 57% of residents rated their local police as good (36.3%) or excellent (21.1%) in terms of protecting people from crime. Just half (50%) of residents, however, rated the local police as good (29%) or excellent (21%) in terms of treatment racial and ethnic minorities. Just over 19% of respondents rated the local police as poor in this area compared to 9.8% with the use of force and 11.6% in terms of protecting people from crime.
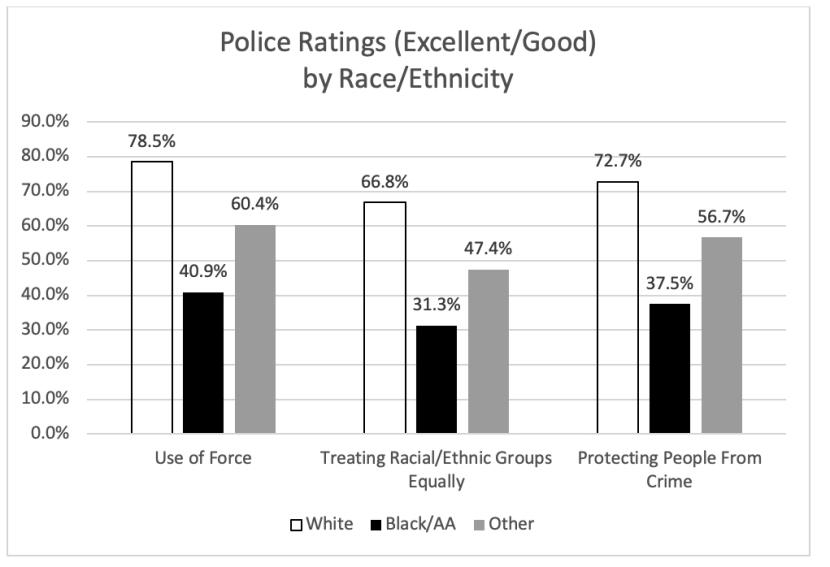
Consistent with national trends and results from prior years of the Life in Hampton Roads survey, there are clear and statistical differences across race/ethnicity in perceptions of local police. For these comparisons, the perception, satisfaction and trust questions were recoded to combine the percentages of the two positive items (e.g., excellent/good, very satisfied/satisfied, a great deal/somewhat). These comparisons showed that the largest differences are between whites and African Americans, with those respondents identifying as something other than white or African Americans generally falling in the middle of the other two groups.
The largest African American/white differences are found in the items asking respondents to rate the job the police in their city are doing in regard to using the right amount of force for each situation, treating racial and ethnic groups equally and protecting people from crime. The differences between whites and African Americans exceeded 33%. There is a 37.6% difference in the ratings of police use of force, and a 35.5% and 35.2% difference for treatment of racial/ethnic minorities and protecting people from crime, respectively.
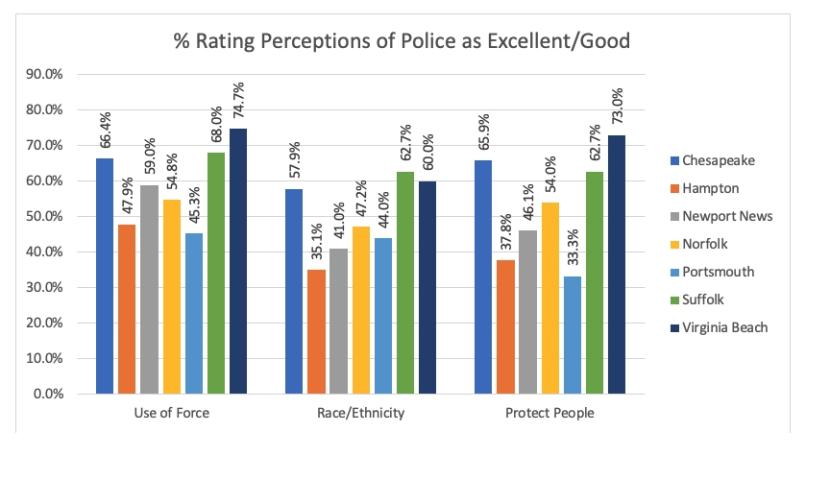
Perceptions of the Police by City
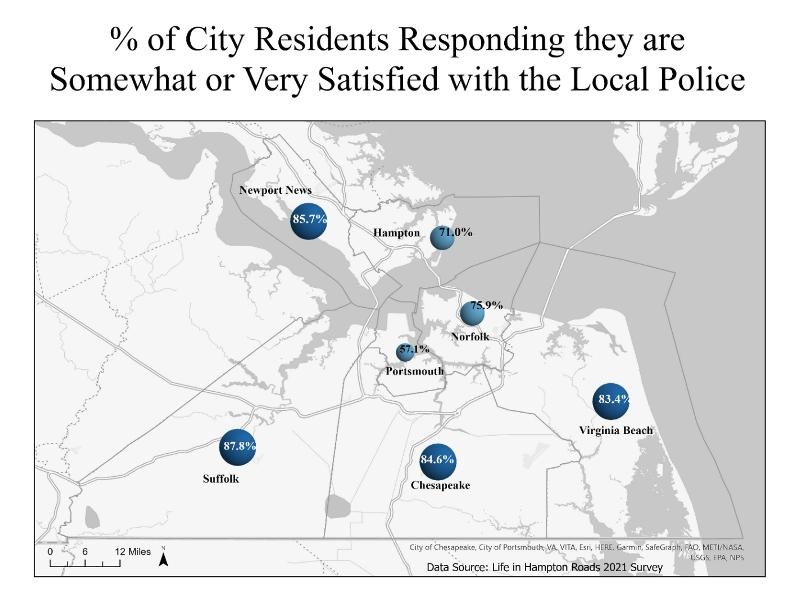
All five attitudinal/perceptual measures of the police varied significantly across the seven cities of Hampton Roads. Several things are clear from the data. First, some consistently rank the police quite highly and certainly more highly than other cities. Specifically, across the board respondents from Virginia Beach, Suffolk and Chesapeake are more trusting and satisfied with the police and rank their police forces higher in terms of use of force, treatment of racial and ethnic minorities, and protecting people from crime. We note that residents of Newport News also rate their police force relatively highly, with over 80% reporting being satisfied with and trusting the police, but their ratings on the three specific items are at least 10 percentage points lower than Virginia Beach (as one point of reference) and this holds true for Hampton, Norfolk and Portsmouth as well. These results suggest that the three more affluent cities with smaller concentrations of racial and ethnic minorities have higher regard for their police forces than the other four.
The Life in Hampton Roads Data report and press releases will be placed on the Social Science Research Center website as they are released (http://www.odu.edu/al/centers/ssrc). Follow-up questions about the 2021 Life in Hampton Roads survey should be addressed to:
Tancy Vandecar-Burdin, PhD
Director
The Social Science Research Center
Old Dominion University
757-683-3802 (office)