
The Social Science Research Center (SSRC) at Old Dominion University recently completed data collection for the 11th annual Life in Hampton Roads (LIHR) survey. The purpose of the survey is to gain insight into residents' perceptions of the quality of life in Hampton Roads and the COVID-19 pandemic, as well as other topics of local interest such as perceptions of police, employment and other issues. A total of 1,105 online surveys were completed between June 26 and July 13 (during Phase 2 and Phase 3 of Virginia's reopening plan). Of these, 1,100 were from residents of the seven Hampton Roads cities included in the Life in Hampton Roads survey and constituted the final dataset.
It is important to note that the methodology this year differs from previous Life in Hampton Roads surveys. For several reasons, including COVID-19 social distancing guidelines and telework directives, we moved from a telephone survey to a web-based design using two panels of respondents. This change limits to some degree the ability to compare this year's results with those from previous years or to as confidently generalize the results to the Hampton Roads population as a whole. Nonetheless, we note that an increasing number of surveys have moved online in recent years, and that in many instances useful data has been developed despite the challenges of online survey research. For more detailed information on the methodological changes and potential impacts please see the methodology section in the pending full report, or please contact the SSRC directly.
Perceptions of Police
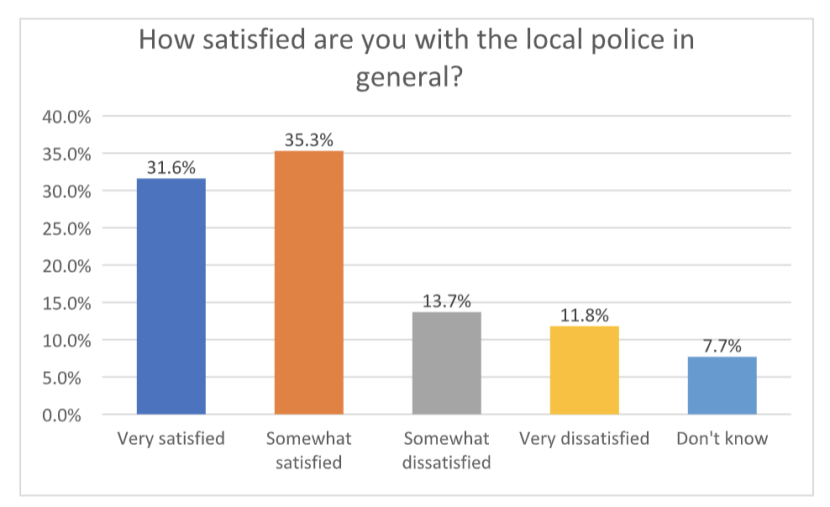
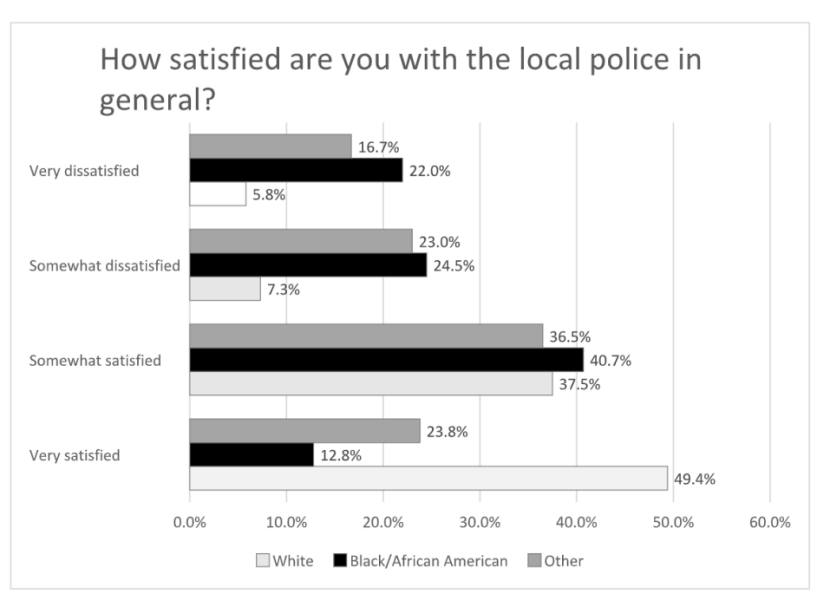
Hampton Roads residents were asked a variety of questions about the police. About two-thirds of respondents reported being very satisfied (31.6%) or somewhat satisfied (35.3%) with the local police. About one-quarter of respondents reported being either somewhat dissatisfied (13.7%) or very dissatisfied (11.8%), and 7.7% indicated that they did not know.
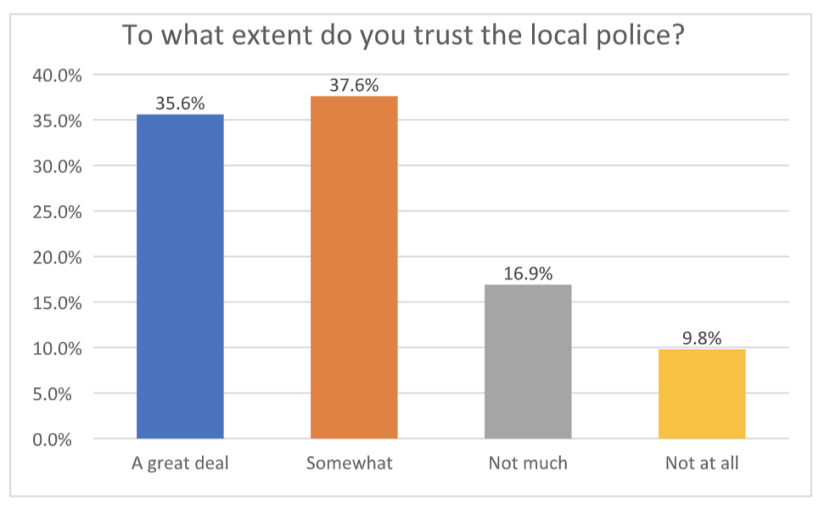
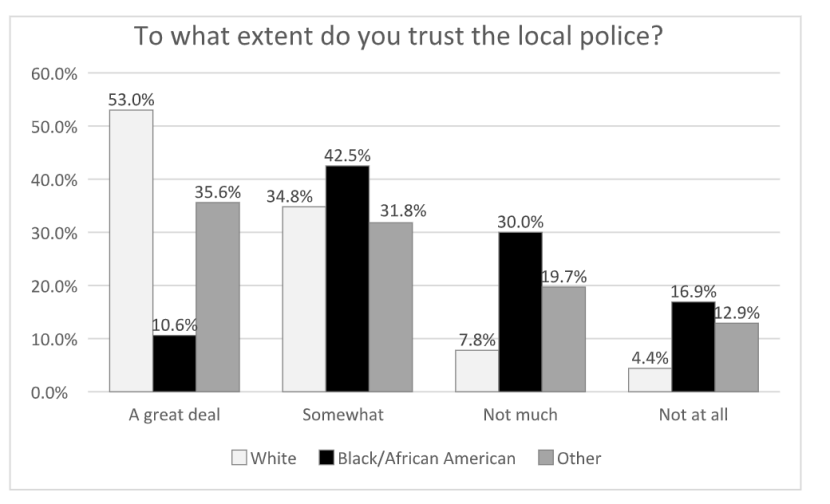
Close to three-quarters of respondents indicated that they trust the local police at least somewhat (37.6%) or a great deal (35.6%). About 17% said they trust the police "not much," and 9.8% trust them "not at all."
When looking at attitudes toward the police, there are significant differences by race. Whites are much more likely than Blacks or other racial groups to be very satisfied with local police. Almost half of white respondents (49.4%) indicate that they are very satisfied compared to only 12.8% of Blacks and 23.8% of those in other racial groups. Close to half of Black respondents (46.5%) reported that they were somewhat or very dissatisfied with local police.
Similar patterns are seen with regard to trust in the local police. More than half of whites (53%) reported trusting the police "a great deal" compared to only 35.6% of other racial groups and 10.6% of Black respondents. Only 4.4% of whites reported trusting police "not at all" compared to 16.9% of black respondents and 12.9% of other racial groups.
Experiences with Police
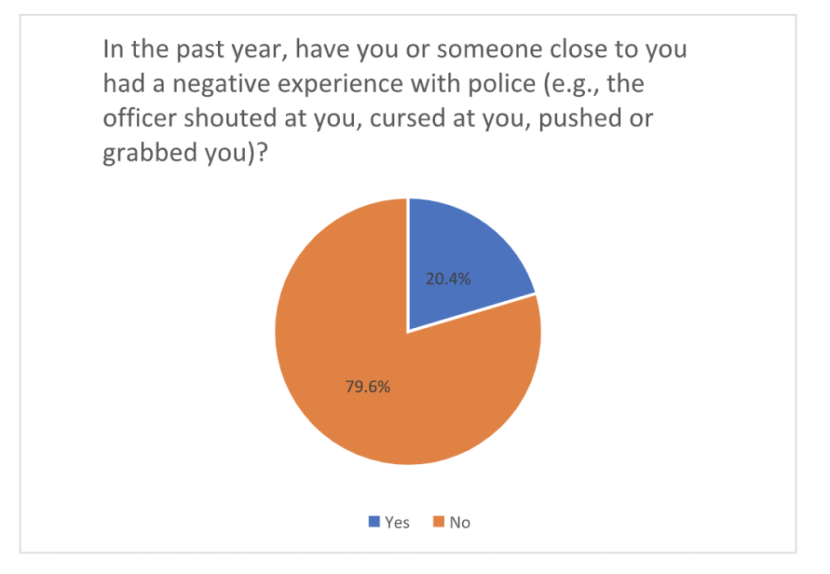
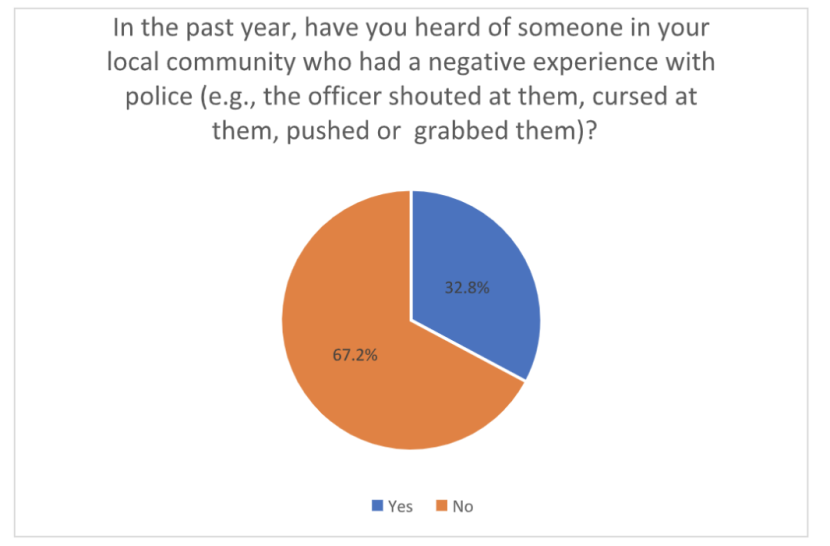
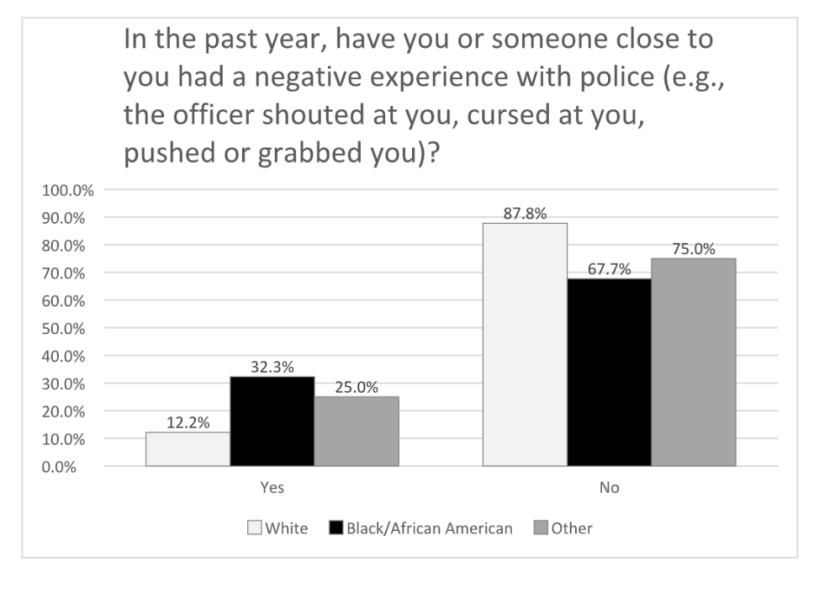
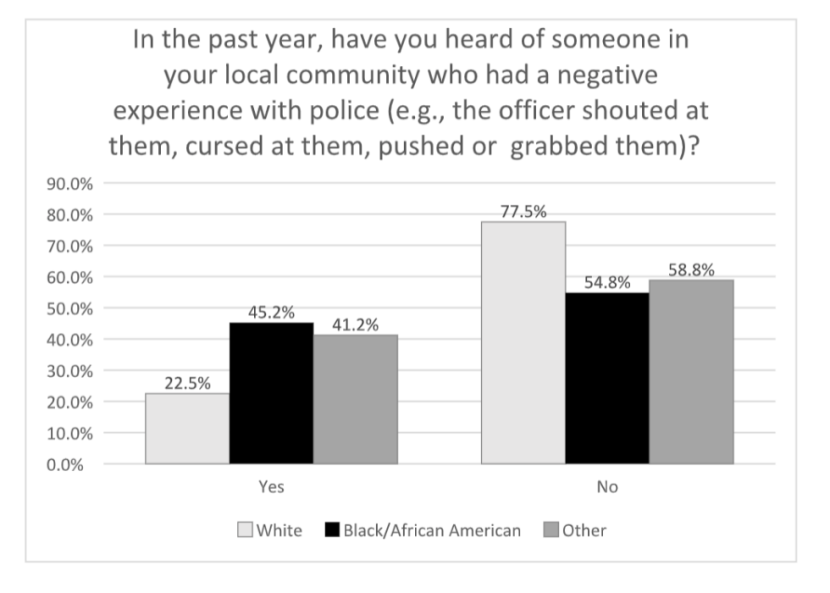
About one in five respondents (20.4%) indicated that they or someone close to them had a negative experience with police (e.g., the officer shouted at them, cursed at them, pushed or grabbed them) within the past year. Close to one-third of respondents (32.8%) have heard of someone in their local community who had a negative experience with police in the past year.
Reports of negative experiences with police also varied significantly by race. Almost one-third (32.3%) of Black respondents reported that they or someone close to them had a negative experience with police in the past year, as did 25% of those in other racial groups. Only 12.2% of white respondents reported a negative experience with police. Similarly, more than four in 10 Black respondents (45.2%) and those from other racial groups (41.2%) reported hearing about someone from their local community having a negative experience within the past year compared to only 22.5% of white respondents.
Protests in Hampton Roads and Police Response
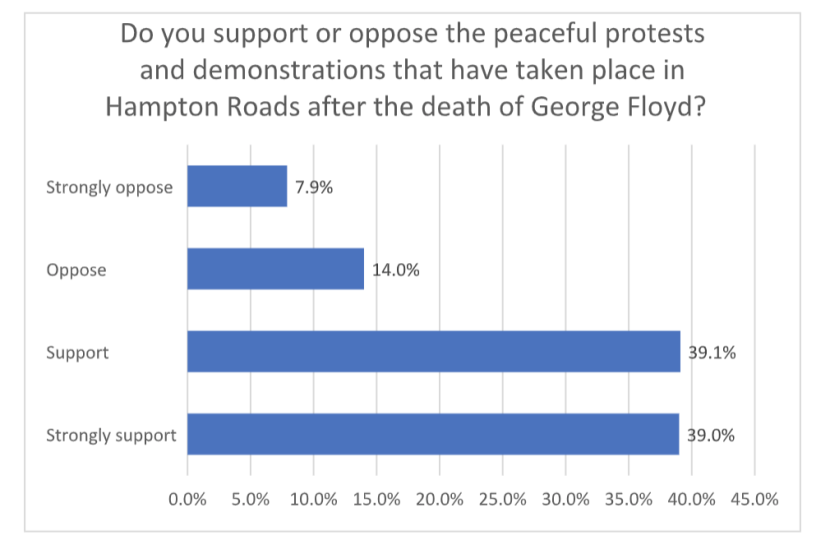
Data collection for the survey started about a month after the death of George Floyd while in police custody -which resulted in nationwide and local protests. Respondents were asked specifically about local protests and the police response to them. Respondents showed general support for the local peaceful protests, with 78.1% indicating they support (39.1%) or strongly support (39%) the local demonstrations.
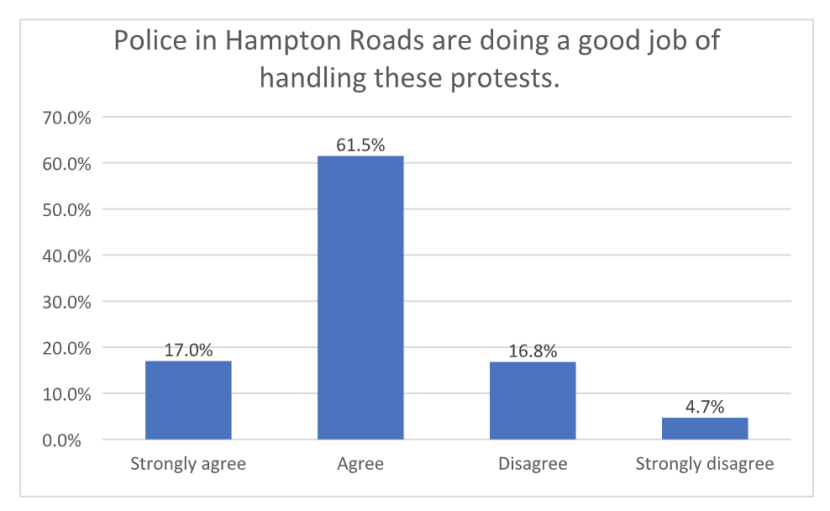
Similarly, more than three-quarters of respondents agreed that police in Hampton Roads are doing a good job of handling the protests (78.5%). Less than 5% strongly disagreed that police are doing a good job.
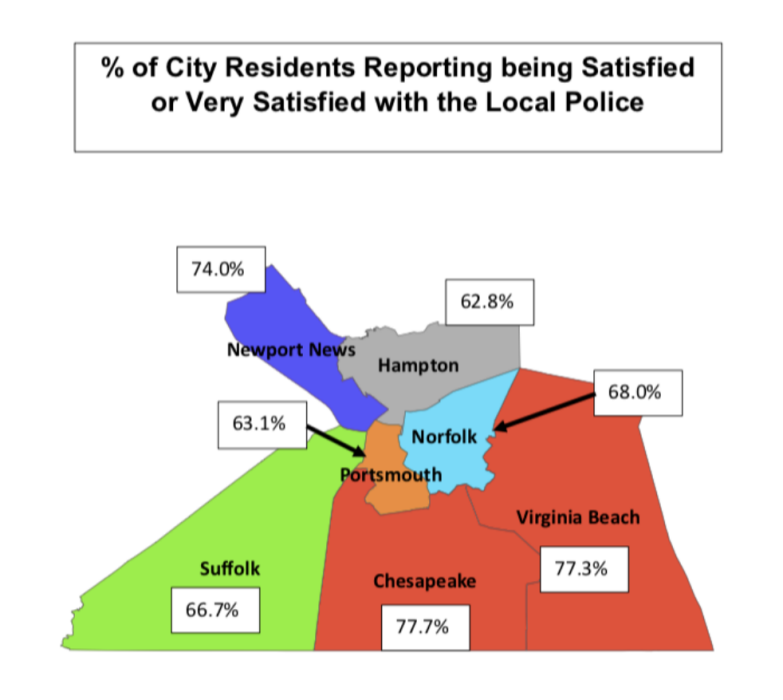
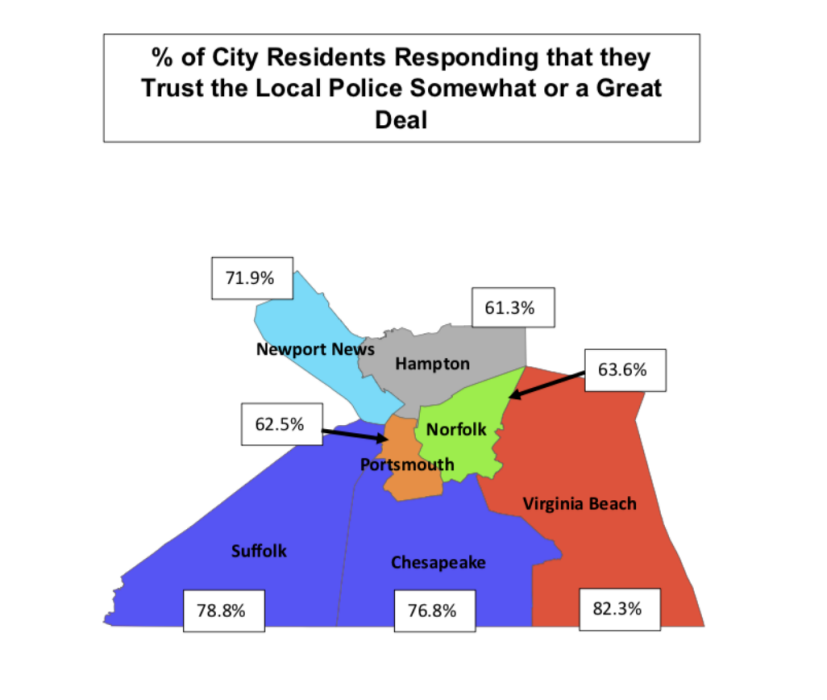
Perceptions of & Experiences with Police Vary by City
Trust and satisfaction with the police varied significantly based on where respondents lived. Satisfaction with police ran from a high of around 77% in both Chesapeake and Virginia Beach to a low of about 63% in both Hampton and Portsmouth. There were even larger disparities across cities in trust of the police. Fewer than two-thirds of respondents in Hampton (61.3%), Portsmouth (62.5%) and Norfolk (63.6%) indicated that they trust the police at least "somewhat." This is contrasted with about three-quarters of Chesapeake and Suffolk respondents and 82.3% of Virginia Beach respondents indicating that they trust the police.
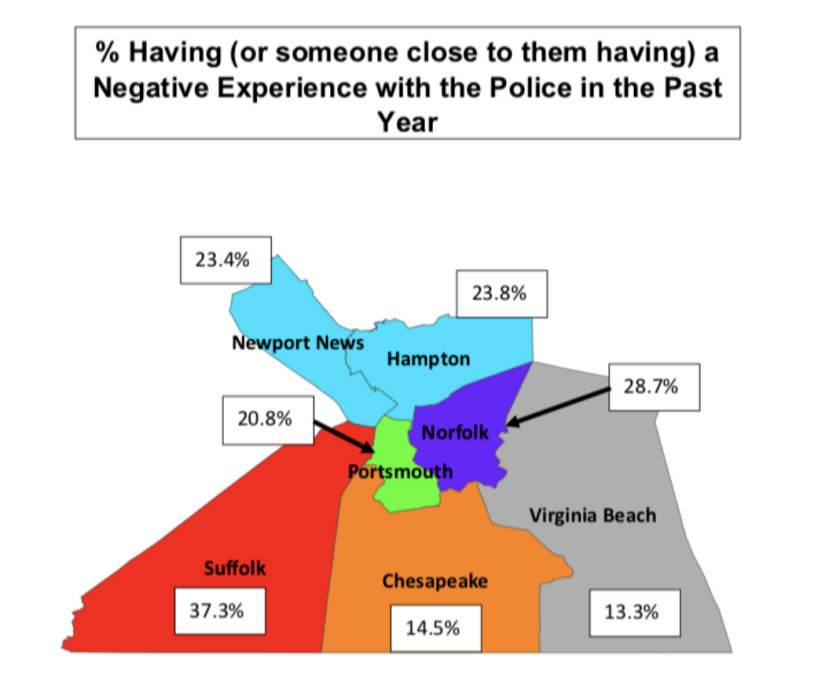
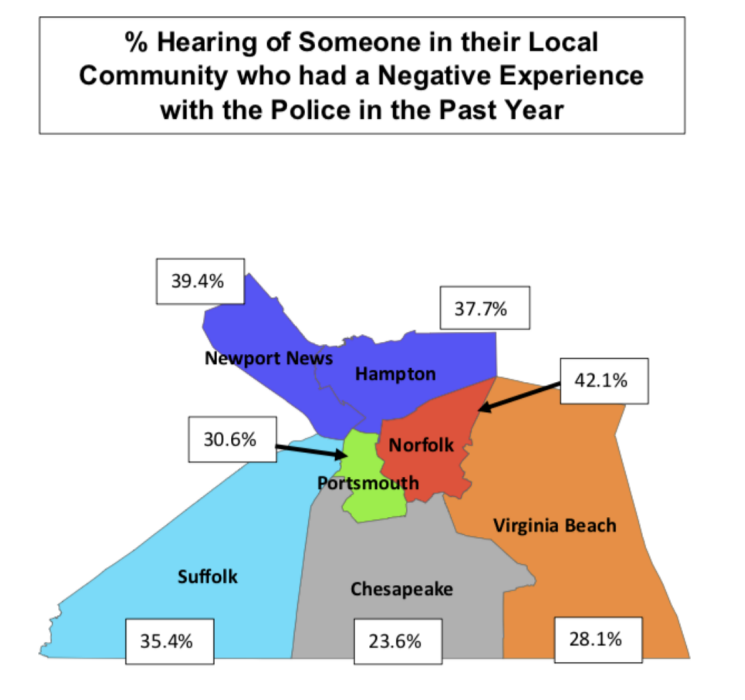
There were also significant differences among cities in terms of negative experiences with police. Only 13.3% of respondents living in Virginia Beach reported that they or someone close to them had a negative experience with the police in the past year. Reports of negative experiences were twice as high in Suffolk (37.3%) and Norfolk (28.7%). More than one in five respondents from Hampton (23.8%) and Newport News (23.4%) reported negative experiences with the police. About 42% of respondents living in Norfolk had heard of someone in their local community having a negative experience with police in the past year as did 39.4% of those living in Newport News. Chesapeake (23.6%) and Virginia Beach (28.1%) again had the lowest percentage of respondents who had heard of someone in their local community having a negative experience with police.
*******************************
For more information, please contact:
Tancy Vandecar-Burdin, Ph.D.
Director, the Social Science Research Center
Old Dominion University
757-683-3802