Introduction
The Social Science Research Center (SSRC) at Old Dominion University recently completed data collection for the 13th annual Life in Hampton Roads (LIHR) survey. The purpose of this survey is to gain insight into residents’ perceptions of the quality of life in Hampton Roads as well as other topics of local interest, such as perceptions of police, politics, the economy, education, health and COVID-19, transportation, and other issues. A total of 639 telephone surveys were completed between May 31 and Aug. 19, 2022. Surveys this year were all completed over the telephone, as was the case prior to 2020. In 2020, due to COVID-19, surveys were completed via online web panels. In 2021, a mixture of online web panels and telephone surveys were utilized. This year, a mixture of listed and random-digit dial (RDD) cellphone and landline telephone numbers were used. From 2012 to 2019, RDD landline and cell phone samples were used. This change limits to some degree the ability to compare this year’s results with those from previous years or to confidently generalize the results to the Hampton Roads population as a whole. However, as with previous years, this year’s survey data was weighted to match a city’s population distribution on several variables including race, Hispanic ethnicity, age and gender, along with access to broadband internet service. For more detailed information on the methodological changes and potential impacts please see the Methodology section in the full report or contact the SSRC directly.
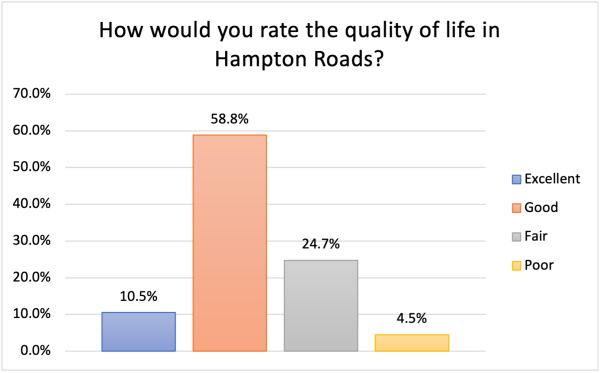
More than two-thirds of respondents rated the quality of life in the region as excellent or good (69.3%). This is slightly higher than last year (65.4%) during the pandemic and more closely reflects previous, non-COVID years (ranging from 68% to 71% between 2017-2019). About one-fourth rated Hampton Roads’ quality of life as fair (24.7%), and 4.5% rated it as poor.
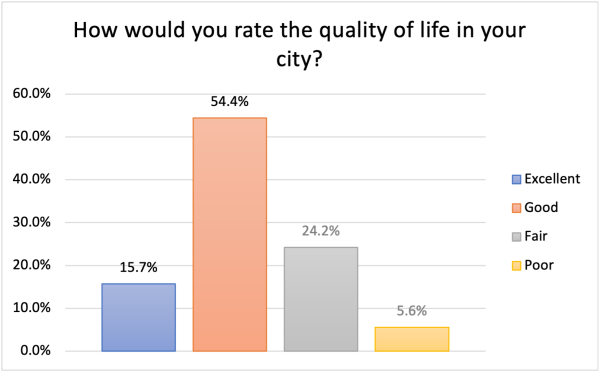
Consistent with previous years, respondents rated the quality of life in their city and their neighborhood higher than they did for the region as a whole. Just over 70% rated the quality of life in their city as good or excellent (70.1%) and 24.2% rated their city as fair. Only 5.6% rated their city’s quality of life as poor.
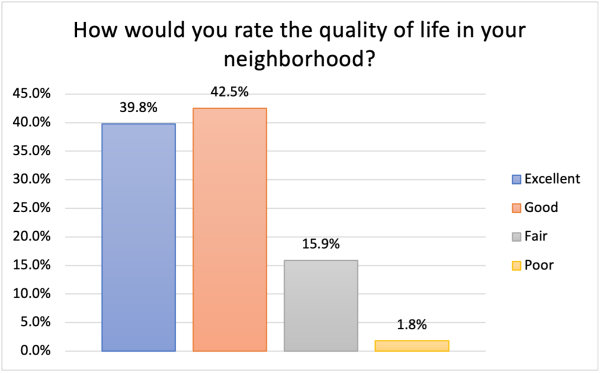
Neighborhood ratings of quality of life were the highest, with 82.3% rating their neighborhood as excellent or good. Only 15.9% rated their neighborhood quality of life as fair and 1.8% rated it as poor.
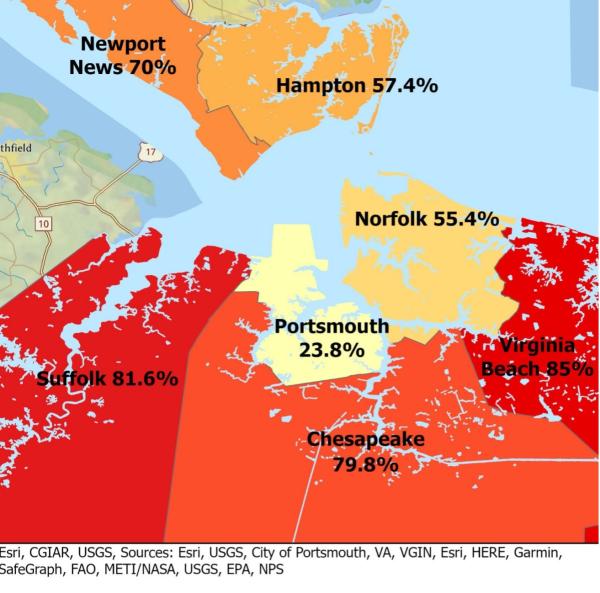
However, there was significant variation in the perceived quality of life across the respective cities. Less than a quarter of the respondents in Portsmouth rated the quality of life in their city good or excellent (24%), while over half similarly rated the quality of life in Norfolk (55%) and Hampton (57%). Seventy percent of Newport News residents rated their quality of life as good or excellent and 80% or more of respondents in Chesapeake (80%), Suffolk (82%) and Virginia Beach (85%) rated their city as such.
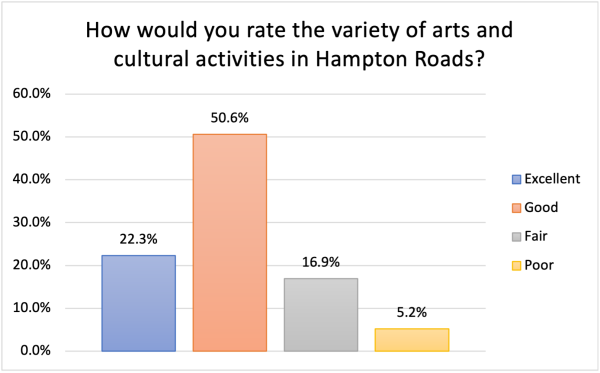
Almost three-quarters of respondents rated the variety of arts and cultural activities in Hampton Roads as excellent (22.3%) or good (50.6%). Another 16.9% rated the variety of arts and cultural activities in Hampton Roads as fair and 5.2% rated the variety as poor.
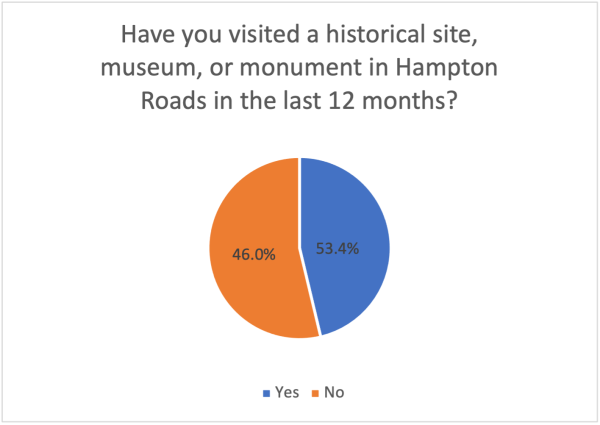
Additionally, more than half of respondents said they had visited a historical site, museum or monument in Hampton Roads in the last 12 months (53.4%).
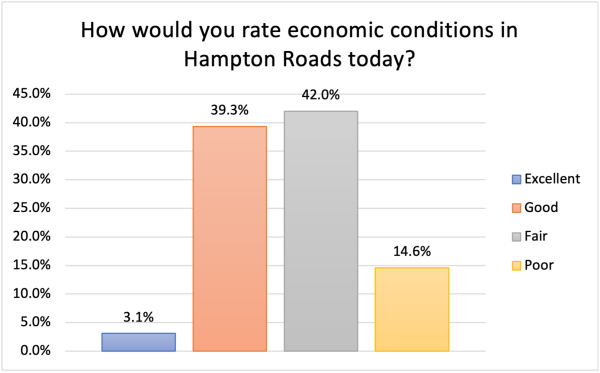
The ratings for economic conditions in Hampton Roads tended to lean toward the middle, with 39.3% rating economic conditions in Hampton Roads as good and another 42% rating economic conditions as fair. Only 3.1% rated economic conditions in Hampton Roads as excellent, while 14.6% rated economic conditions in Hampton Roads as poor. The percentages closely resemble last year’s, when 6.5% rated economic conditions in Hampton Roads as excellent and 41.4% rated them as fair.
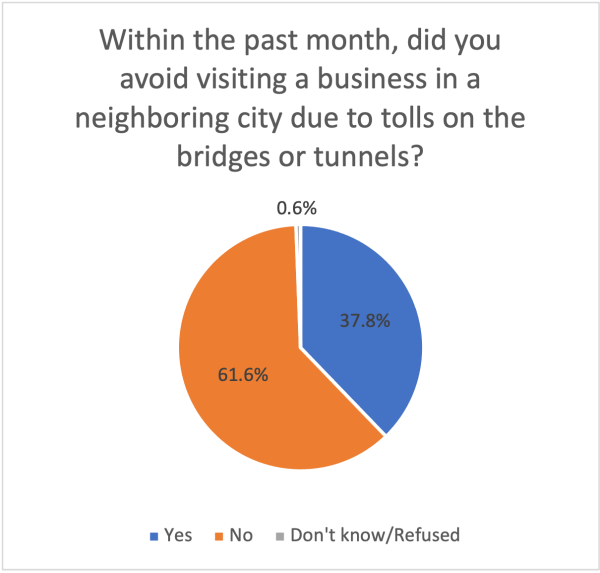
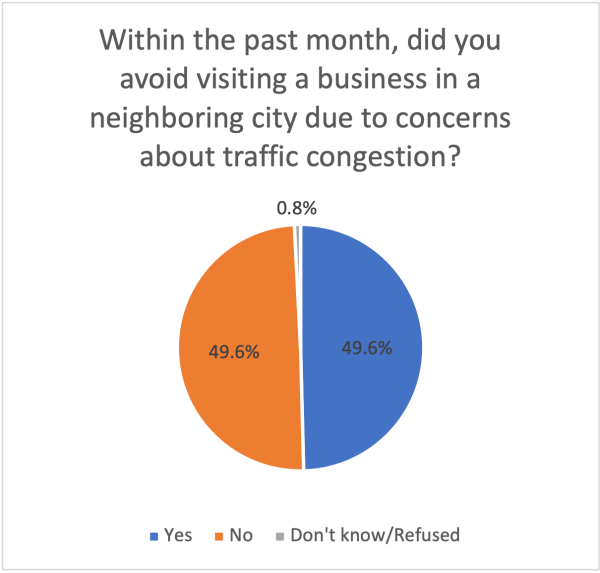
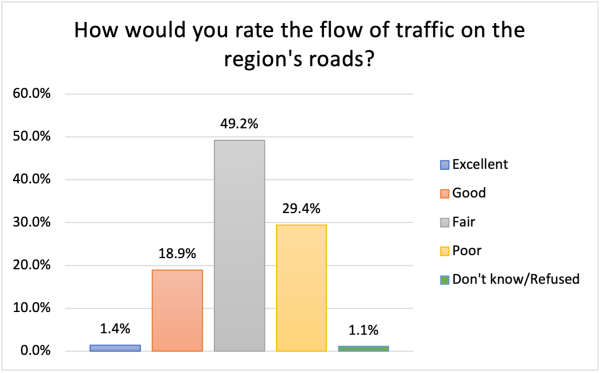
Fewer than one in four respondents (37.8%) reported avoiding visiting a business in a neighboring city due to tolls on the bridges or tunnels. However, almost half of respondents (49.6%) reported avoiding visiting a business in a neighboring city due to traffic congestion. Furthermore, 78.6% of respondents rated the flow of traffic on the region’s roads as either fair (49.2%) or poor (29.4%). A staggeringly low 1.4% rated the flow of traffic on the region’s roads as excellent and 18.9% rated the flow as good.
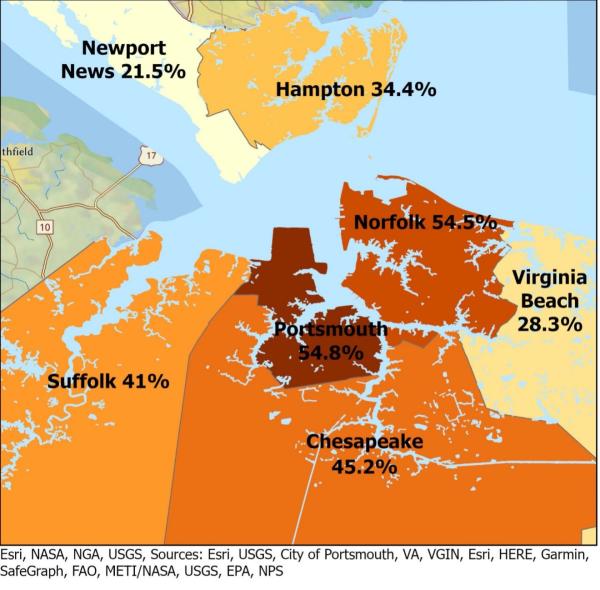
Significant variation did exist across cities in the percentage of respondents who reported avoiding visiting a business in neighboring cities because of concern over traffic congestion. Less than a third of respondents in Newport News (22%) and Virginia Beach (28%) reported avoiding visiting a business in a neighboring city compared to about one-third of respondents in Hampton (34%). Less than half of respondents in Suffolk (41%) and Chesapeake (45%) avoided visiting a business in a neighboring city, as did more than half in Norfolk and Portsmouth (both 55%).