

Introduction
The Social Science Research Center (SSRC) at Old Dominion University recently completed data collection for the 13th annual Life in Hampton Roads (LIHR) survey. The purpose of this survey is to gain insight into residents’ perceptions of the quality of life in Hampton Roads as well as other topics of local interest such as perceptions of police, politics, the economy, education, health and COVID-19, transportation and other issues. A total of 639 telephone surveys were completed between May 31 and Aug. 19, 2022. Surveys this year were all completed over the telephone, as was the case prior to 2020. In 2020, due to COVID-19, surveys were completed via online web panels. In 2021, a mixture of online web panels and telephone surveys were utilized. This year, a mixture of listed and random-digit dial (RDD) cellphone and landline telephone numbers were used. From 2012 to 2019, RDD landline and cell phone samples were used. This change limits to some degree, the ability to compare this year’s results with those from previous years or to confidently generalize the results to the Hampton Roads population as a whole. However, as with previous years, this year’s survey data was weighted to match a city’s population distribution on several variables including race, Hispanic ethnicity, age and gender along with access to broadband internet service. For more detailed information on the methodological changes and potential impacts, please see the Methodology section in the full report or contact the SSRC directly.
Politics
The Life in Hampton Roads survey always includes a few questions about political attitudes. In 2022 the questions included party affiliation, political ideology, job approval of President Biden, Gov. Youngkin and local mayors.
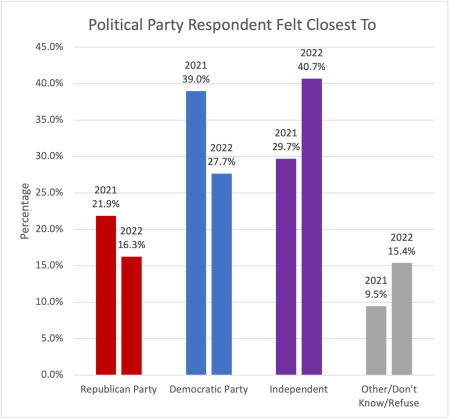
Political party affiliation among respondents to the survey continued to lean substantially toward the Democratic Party, in line with past surveys in Hampton Roads. Nearly three in 10 (27.7%) respondents said they felt closest to the Democratic party when asked the question “Do you generally feel closer to the Democratic Party, the Republican Party, or do you consider yourself to be an independent or something else.” Another 16.3% identified with the Republican Party. But this represents a substantial decline for both parties from last year, with the portion of respondents who indicated that they were political independents or affiliated with some other party surging to the highest levels we have seen in some time. Last year we found “a trend toward more individuals indicating a major party they felt closest to, especially on the Democratic side,” but this trend seems to have sharply reversed in 2022 with a majority of individuals indicating that they are political independents or affiliated with some other party.
This year we also brought back a political ideology question that hadn’t been asked for several years. Individuals were asked to describe their political views on a seven-point scale ranging from extremely liberal to extremely conservative. This item suggests that the region is quite balanced ideologically, with nearly equal numbers of liberals, moderates and conservatives.
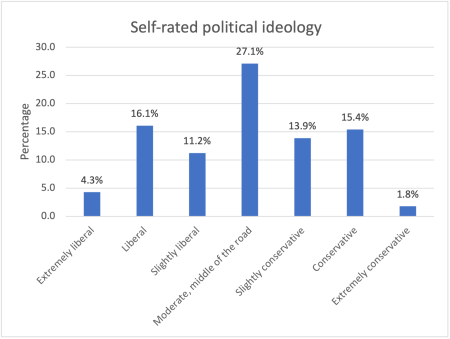
As can be seen in the chart, the largest group of respondents were those who said they were moderate (27.1%). The next largest groups were those who described themselves as liberal (16.1%) and conservative (15.4%). Overall, 31.6% of respondents described themselves as liberal (summing across the three liberal categories) and 31.1% described themselves as conservative. Roughly one in 10 respondents either refused to state their ideology (6.6%) or indicated that they did not know (3.6%).
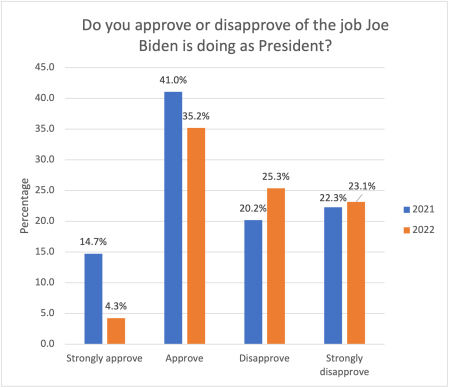
Overall, respondents’ attitudes towards President Joe Biden’s job performance were down from the 2021 survey, in line with changing national trends in his approval rating. The percentage who strongly approved of Biden’s job performance dropped by about 10 percentage points (from 14.7% to 4.3%), and the percentage who approved also dropped by more than five points (from 41% to 35.2%).
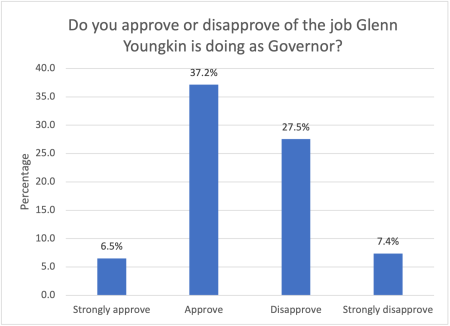
At the time that the survey was conducted, Glenn Youngkin had been governor for several months. Opinions of his job performance were mixed, with 43.7% approving or strongly approving and 34.9% disapproving or strongly disapproving. More than 20% of respondents indicated that they either did not know (15.7%) or refused to answer (5.6%). Since Youngkin received roughly 45% of the vote in the November 2021 gubernatorial election within the seven cities surveyed (217,129 out of 479,886 votes), this level of approval seems consistent with neither major gains nor losses in popularity for the governor at this point in his administration.
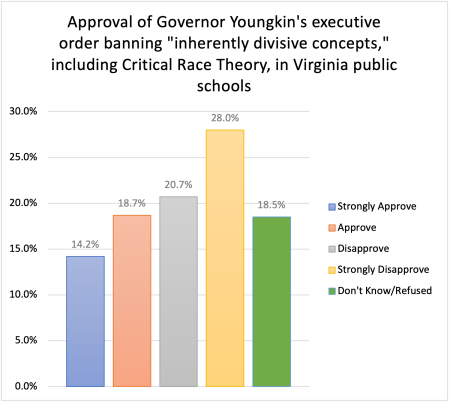
One of the issues Gov. Youngkin campaigned on was education, and an early action by the governor in involved an executive order banning “inherently divisive concepts,” including Critical Race Theory, in Virginia public schools. Evaluations of this action were much more negative than overall evaluations of the governor and divided the governor’s support base to a somewhat greater degree than his opponents. Approximately one-third (32.9%) of respondents indicated that they approved or strongly approved of the order, but nearly half (48.7%) disapproved. As with the gubernatorial job approval question, a substantial portion of respondents indicated that they did not know or refused to answer the question (18.5%). The executive order divided the governor’s supporters. Almost a quarter of the respondents who approved or strongly approved of the governor’s job performance disapproved or strongly disapproved of the executive order (23.6%), among Republicans 13.4% disapproved or strongly disapproved the action, and among respondents who identified as conservative or extremely conservative, 21.1% disapproved or strongly disapproved. The governor’s opponents more uniformly failed to approve the order with 7.4% of Democrats, 6.7% of those who disapproved of the governor and 4.6% of those who identified as liberal or extremely liberal voicing approval or strong approval for the executive order.
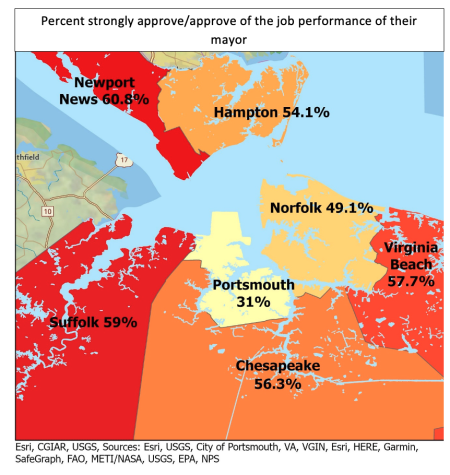
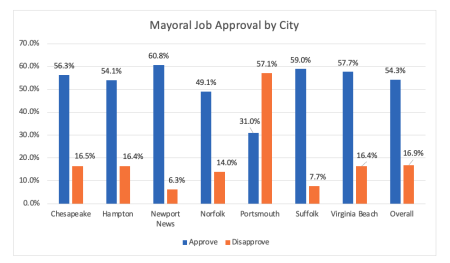
We also asked about mayoral job approval. Responses to this question were relatively strong for most mayors. More than half of respondents indicated that they approved (54.2%) with only 16.9% voicing disapproval. We observed similar patterns for most regional cities, with the exception of Portsmouth. Only 31% of Portsmouth residents surveyed indicated that they approved of “the job your local mayor is doing” while 57.1% indicated that they disapproved. It is important to remember that the overall sample sizes here are quite small at the city level – only 38 Portsmouth residents responded to the survey. Nonetheless, the data seem› to suggest that while the residents of most cities are relatively happy with the job performance of their mayor, Portsmouth residents appear to be an exception.
News Sources
This year, for the first time, respondents were asked to identify their sources of information about local news with the question: “Which of the following sources do you typically use to learn about local news in Hampton Roads?” Respondents could select all that applied from among the following options: local television news; newspapers; internet sites, social media or blogs; radio news or talk shows; and other. Respondents could also indicate that they do not obtain local Hampton Roads news as well as “don’t know” or “refused.”
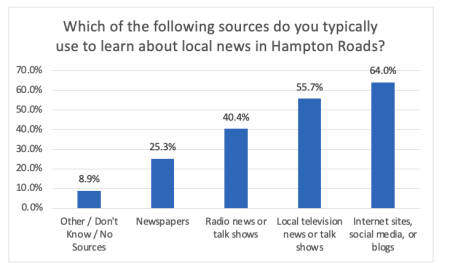
Most respondents selected at least one news source. Among the four sources, newspapers had the smallest share, with one in four respondents (25.3%) indicating that they use them to learn about local news. Radio news (40.4%) and local television news or talk shows (55.7%) had substantially larger proportions, and internet sites, social media or blogs were the most common source, used by almost two-thirds of respondents (64%).
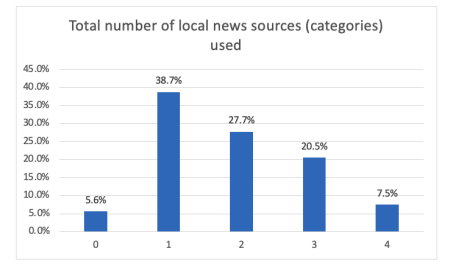
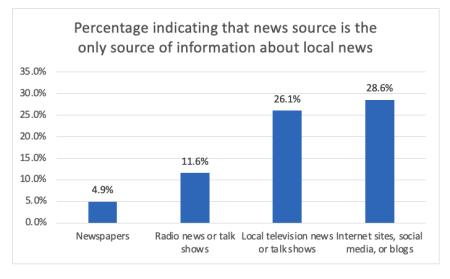
Slightly more than half of respondents named at least two news sources (55.7%) and slightly more than a third of respondents (38.7%) named only one news source. There were striking differences across the news sources in the frequency with which the news source was the only source of information. Only 4.9% cited newspapers as their only source. By contrast, more than a quarter of respondents who relied on local television (26.1%) and the internet (28.6%) had no other source of information.
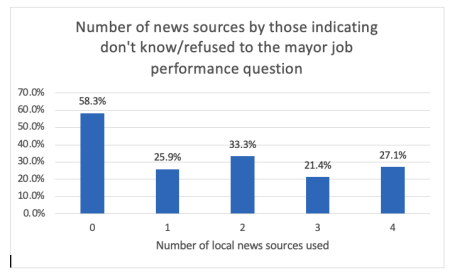
Does it matter how many sources of information one has about local news? More than a quarter of respondents to the local mayor job approval question indicated that they either did not know (22.5%) or that they refused to answer (6.4%). Perhaps unwillingness or inability to answer the question reflects a lack of information about that performance, in part due to consuming minimal amounts of local news. More than half of the respondents who consult none of the four categories of news sources did not express an opinion about the job performance of their local mayor (58.3%) while a third or less of the respondents in all other categories did not evaluate the job performance of their local mayor. Failure to attend to local news may render citizens less able to effectively participate in local politics.[1]
[1] Across the different news sources, those who consulted any news source were more likely to answer the mayor job approval question. But the difference was only statistically significant (p<0.1) for newspapers and local television news, and the effect was largest (and most statistically significant) for local television news. One-third (33.9%) of respondents who did not watch local TV news failed to rate their local mayor’s job performance, while only 25% of those who did watch failed to rate mayoral job performance.
The Life in Hampton Roads Data report and press releases will be placed on the Social Science Research Center website as they are released (http://www.odu.edu/al/centers/ssrc). Follow-up questions about the 2022 Life in Hampton Roads survey should be addressed to:
Tancy Vandecar-Burdin, PhD
Director, The Social Science Research Center
Old Dominion University
757-683-3802 (office)