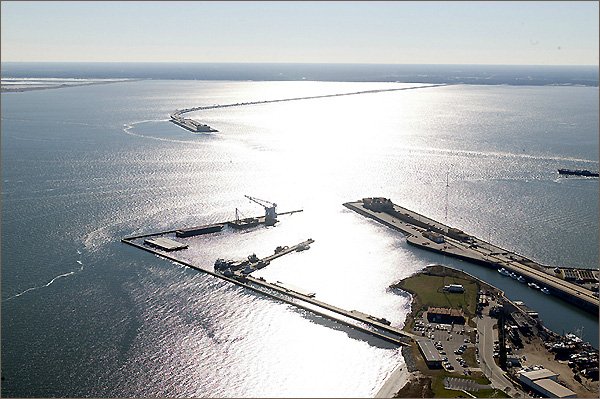

People traverse the 11 bridges and five tunnels in Hampton Roads every day, commuting for work, family and other activities.
This report examines regional perceptions of transportation-related issues from the 2018 Life In Hampton Roads survey (LIHR 2018) conducted by the Old Dominion University Social Science Research Center. Data from prior years is also provided when available to show comparisons in responses over time. Responses were weighted by city population, race, age, gender and phone usage (cell versus land-line) to be representative of the Hampton Roads region. For additional information on survey methodology, and analyses of other issues, please see the SSRC website.
Transportation
People traverse the 11 bridges and five tunnels in Hampton Roads every day, commuting for work, family and other activities. The 2018 Life in Hampton Roads survey asked residents for their opinions on bridge and tunnel tolls and about alternative transportation.
Hampton Roads residents report fairly consistent numbers in average commute times to work or school, hovering between 18 and 24 minutes. In 2014 the average commute time was around 24 minutes, then decreased to 20 minutes in 2015. In 2016, this average decreased even further to 18.1 minutes, the lowest reported commute time of the survey. In 2017, the reported commute time was 19.2 minutes, and that increased again slightly this year to 21.5 minutes.
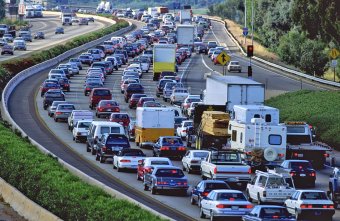
Traffic Congestion
The Life in Hampton Roads survey asked residents if they avoided visiting a business in a neighboring city due to concerns about traffic congestion within the past month. Less than half of respondents (47.3 percent) said they did, while 51.8 percent did not. These percentages are consistent with previous years' data.
Tolls Bridge & Tunnels
Wanting to get a sense of the role that bridges and tunnels play in Hampton Roads everyday life, we asked survey respondents if they used a toll bridge or tunnel to commute to work or school. Interestingly, more than three-fourths (76.4 percent) of respondents said that they do not use a toll bridge.
We subsequently asked if respondents avoided visiting a business in a neighboring city due to tolls within the past month. Over 63 percent of respondents stated that tolls weren't a determining factor, while 36.4 percent said they do avoid businesses because tolls.
The survey respondents were asked about what actions they have taken, if any, to avoid tolls. Almost half (48.3 percent) stated that they do not intentionally avoid tolls. Of those who said they do avoid the tolls, the most common response (54.2 percent) was that respondents took a different route to school or work. Another 13.4 percent of respondents said they reduced travel during peak periods.
Regarding light rain, this year's survey remained consistent with a relatively small percentage of respondents not wanting the light rail expanded (12.1 percent). However, there is a reduction when it comes to wanting to see light rail expanded to certain cities and locations. Fifty-five percent of respondents want light rail expanded to the Virginia Beach Oceanfront. Additionally, 41.2 percent would like to see the light rail expanded to Virginia Beach Town Center, 40.6 percent to the Naval Base and 39.9 percent to Norfolk International Airport. More than 30 percent want light rail expanded to Hampton (34.8 percent), Chesapeake (33.6 percent), Newport News (33.2 percent) and Portsmouth (30.7 percent). Only 22.7 percent wished to see the light rail expanded to Suffolk.
The section of highway on I-64 between the I-264 Interchange and I-564 in Norfolk was previously a High Occupancy Vehicle (HOV) lane. That section is now a tolled I-64 Express Lane segment, also called a high occupancy toll (HOT) lane. This year's LIHR survey aimed to learn how often Hampton Roads residents were using the HOT lanes and how they thought the HOT lanes affected their travel. The majority of respondents said they never use the HOT lanes (67.6 percent), while 15.1 percent use the lanes about once a month. Another 10.2 percent use the HOT lanes several times per month. Only 2.7 percent use the HOT lanes several times per week and 2.4 percent use them about once a day.
Regardless of whether the respondents said they use the HOT lanes, they were then asked how they have affected their travel. The majority of respondents (64 percent) said they saw no difference in their travel since the lanes opened. Additionally, 13.4 percent said travel is somewhat better and 4.9 percent said travel is much better. Another 6.7 percent said that travel is somewhat worse and 3.4 percent said travel is much worse.
All Life in Hampton Roads Data Analyses will be placed on the Social Science Research Center website as they are released. Follow-up questions about the 2018 Life in Hampton Roads survey should be addressed to:
Randy Gainey, PhD
Faculty Director
The Social Science Research Center
Professor of Sociology and Criminal Justice
Old Dominion University
757-683-4794 (office)
rgainey@odu.edu
or
Tancy Vandecar-Burdin, PhD
Associate Director
The Social Science Research Center
Old Dominion University
757-683-3802 (office)
tvandeca@odu.edu